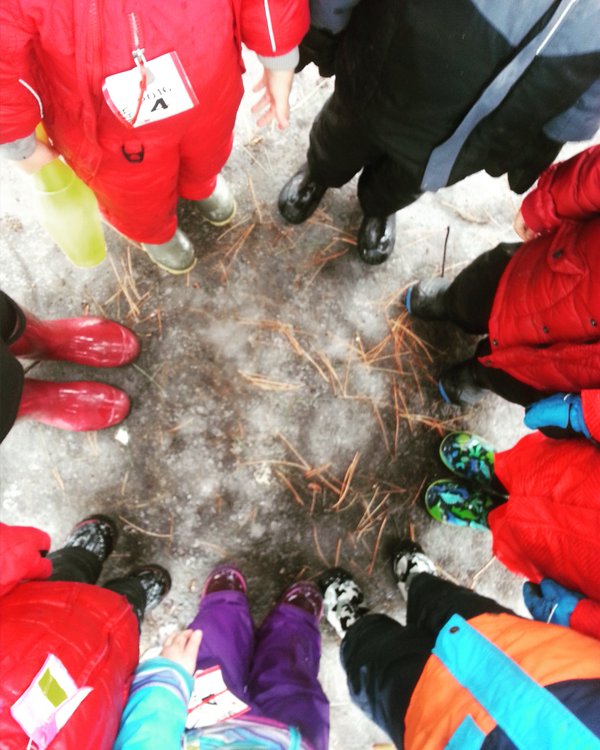
Last week, we went down to our cubbies to collect some data on all the winter clothing items we had at school. Each student took a turn to go to their cubby and answer yes or no to whether they had the various items on our list.
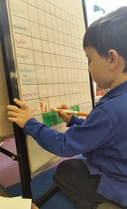
Today, we looked at all the data and graphed it! We also learned how to read this type of graph quickly and efficiently without having to count every coloured box in the row. Each student took a turn filling in one of the bars on the graph and then we reread all the data together!
 RSS Feed
