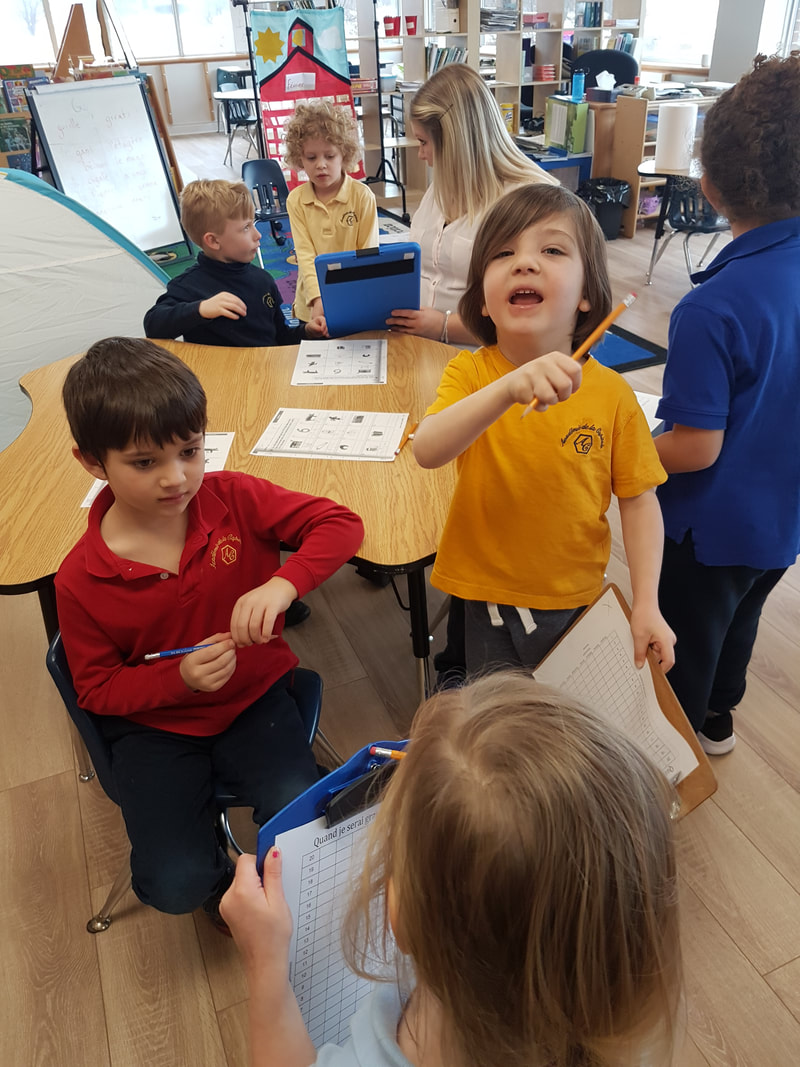
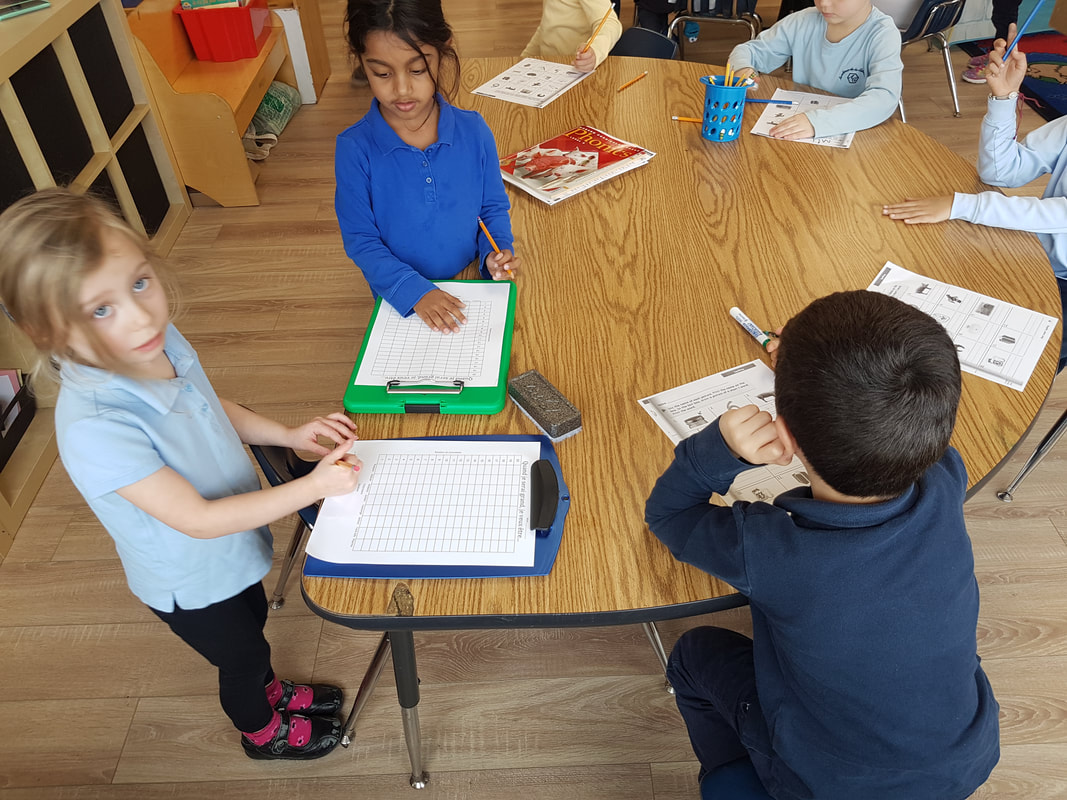
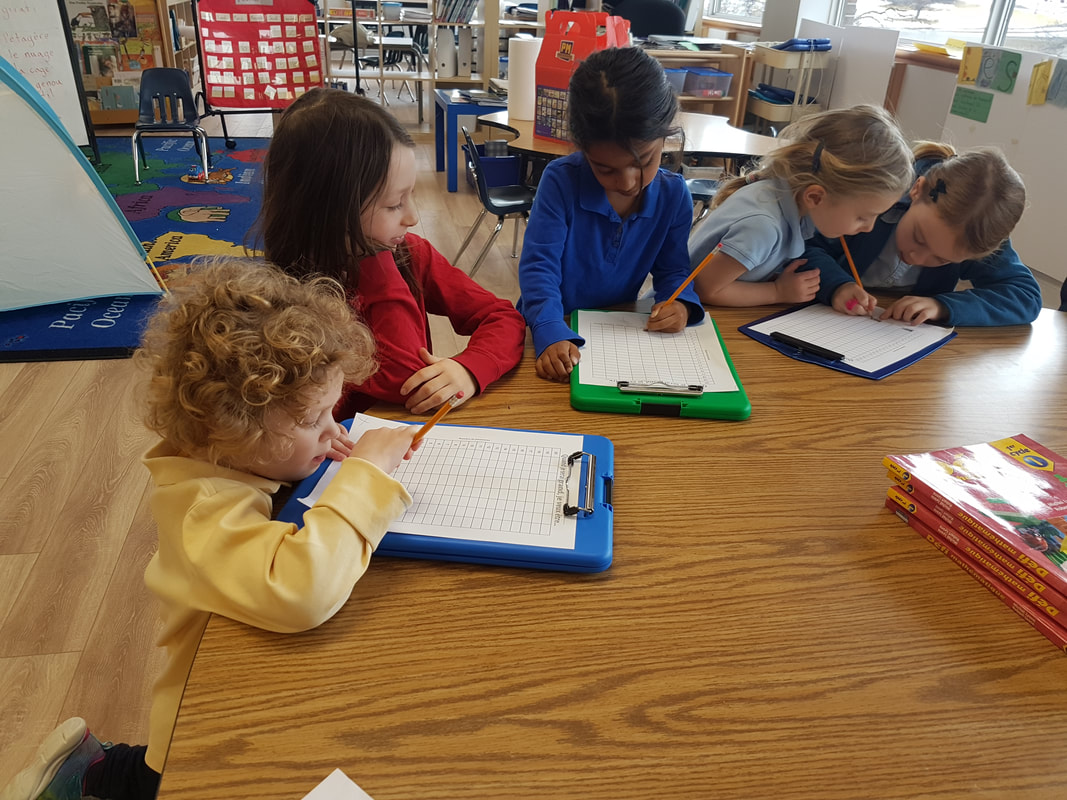
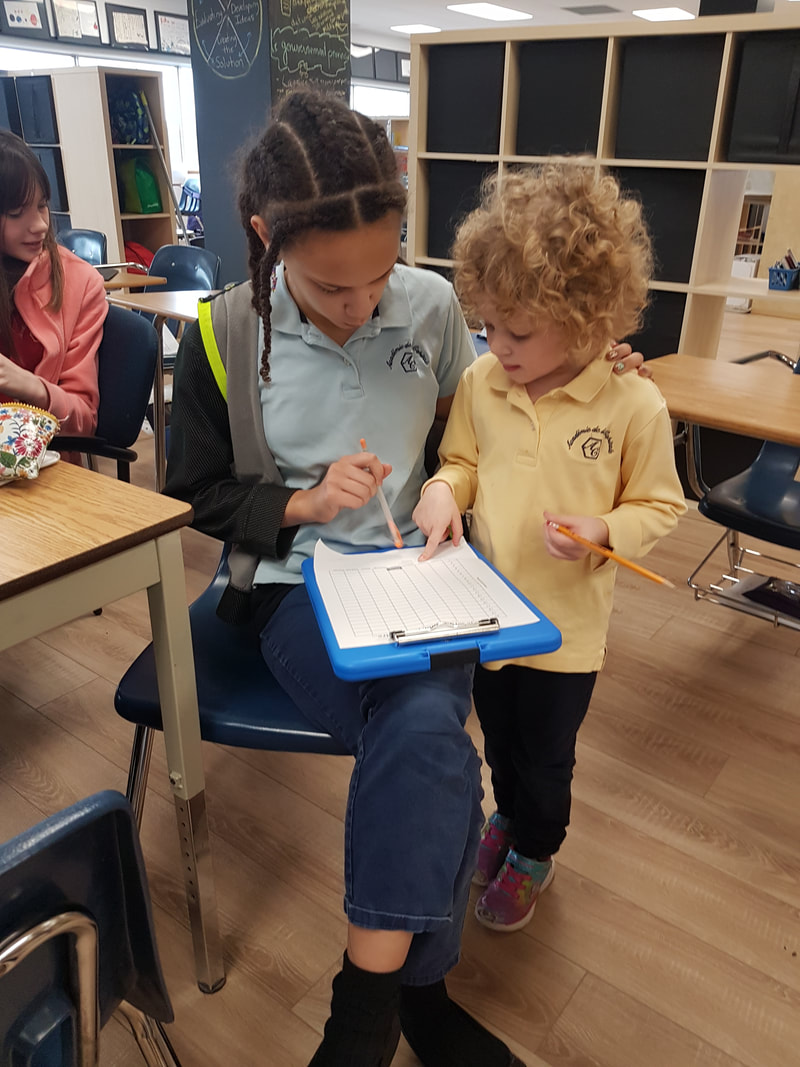
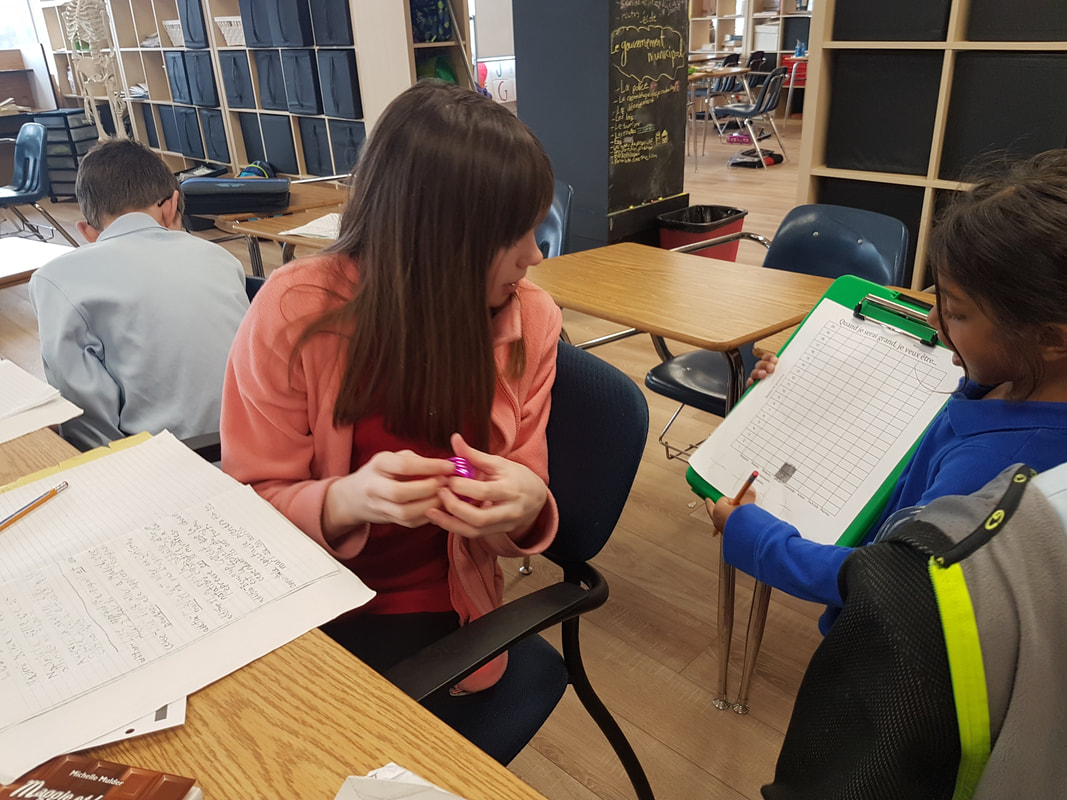
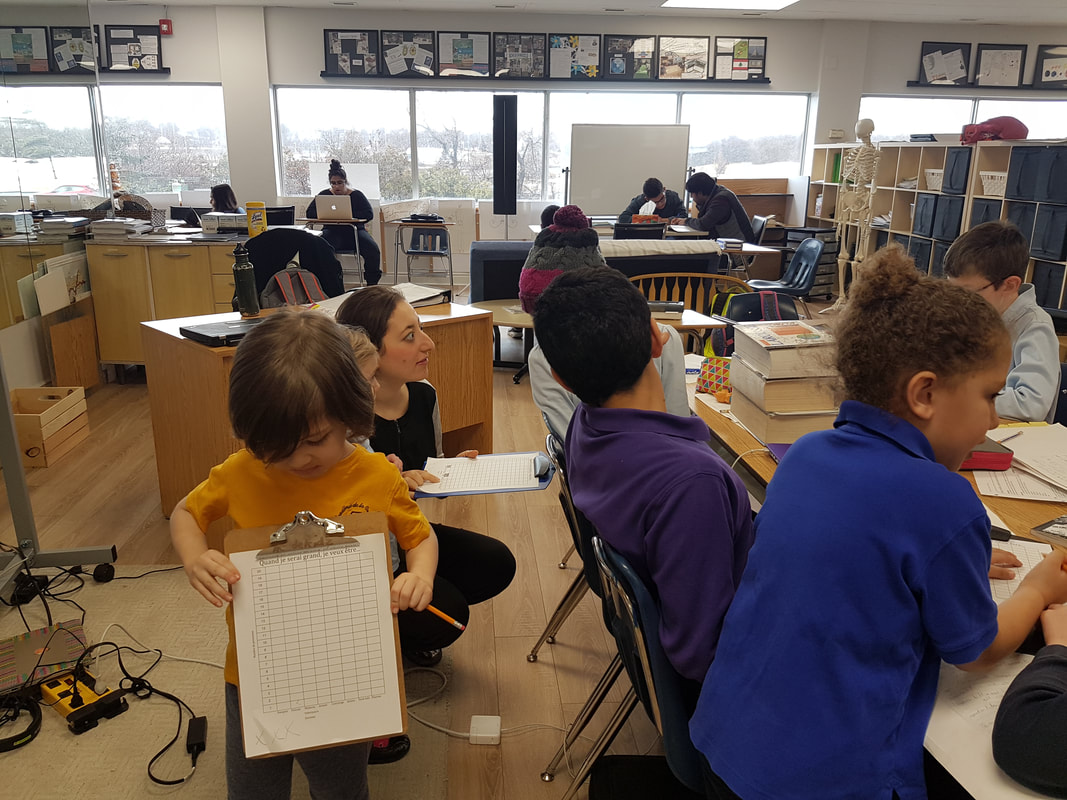
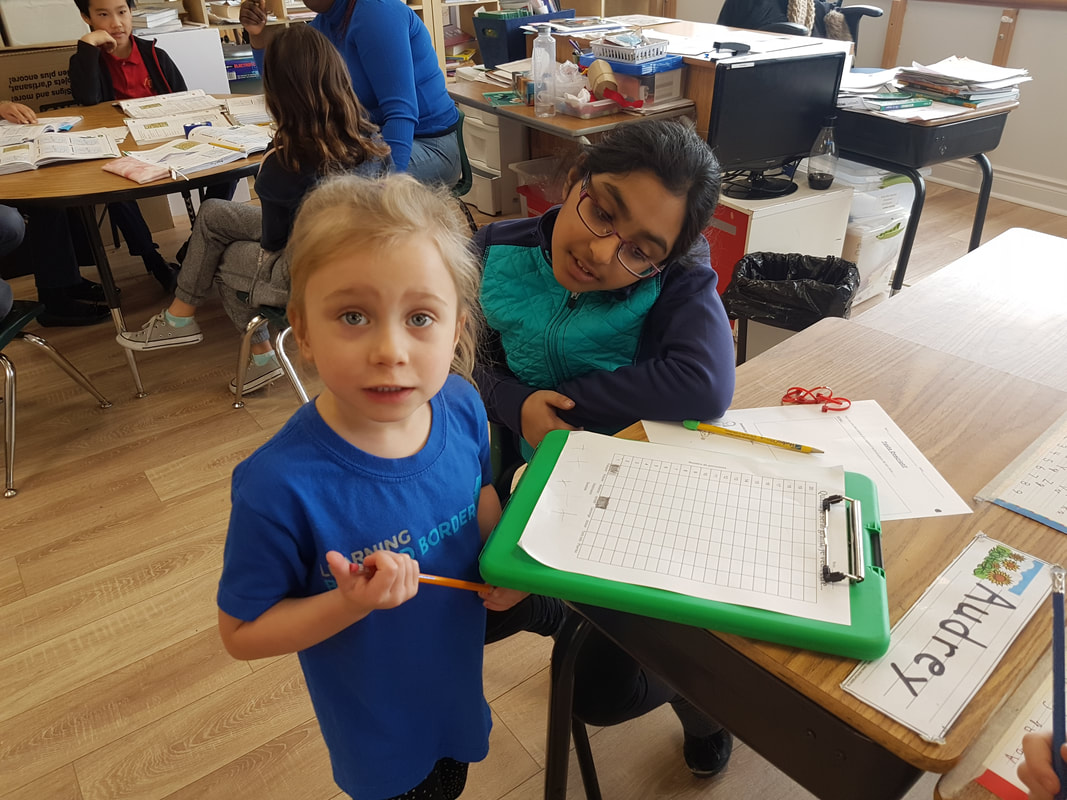
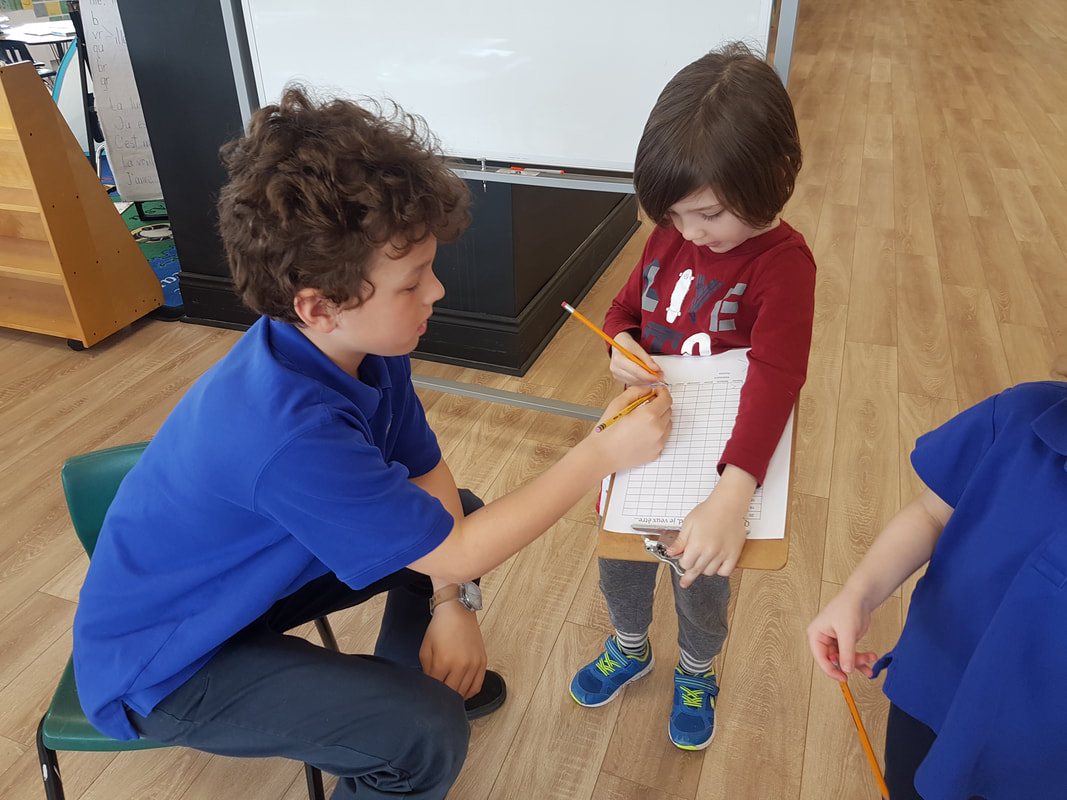
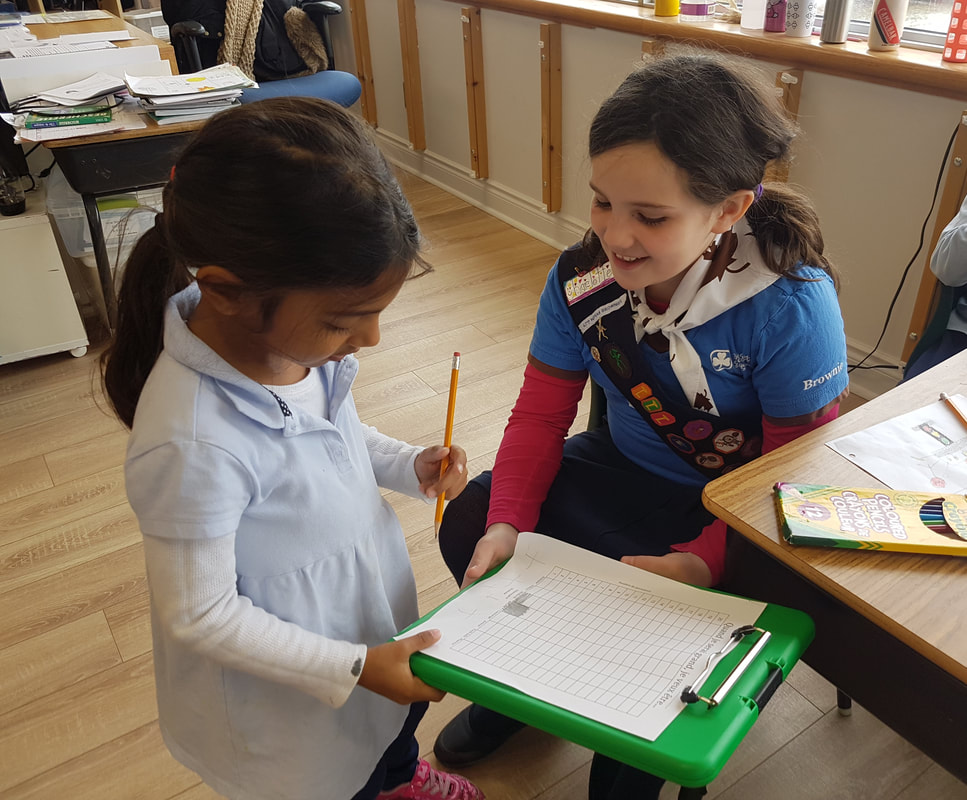
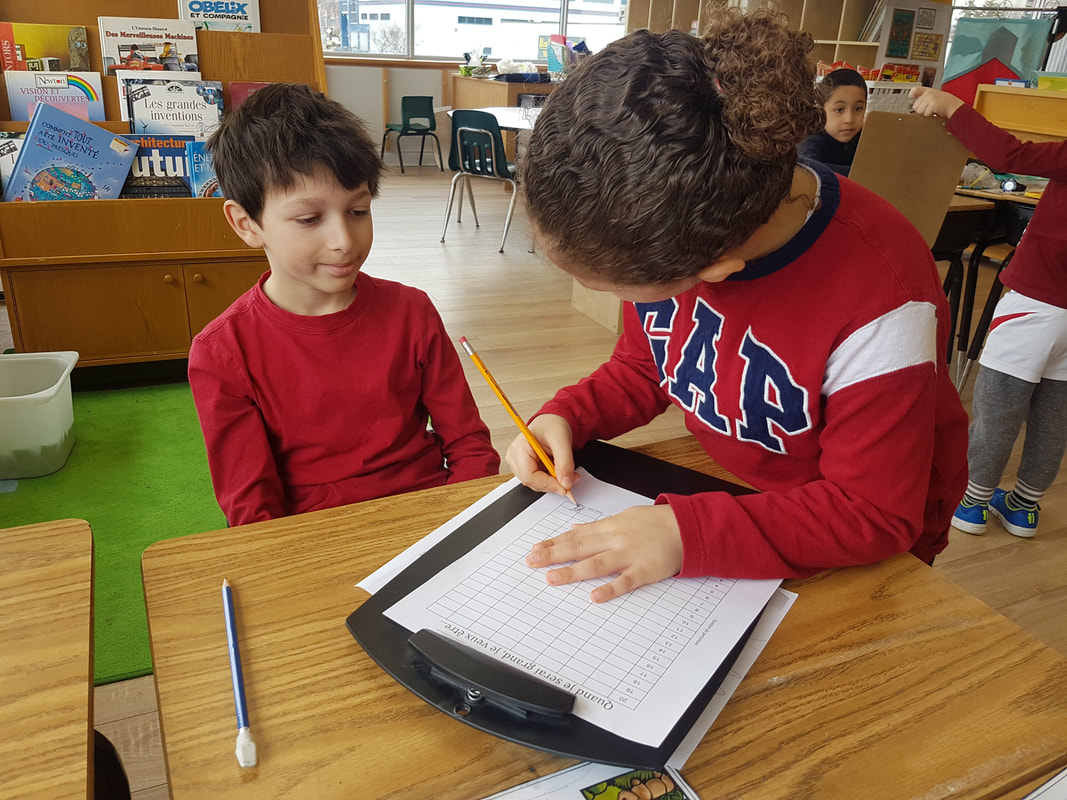
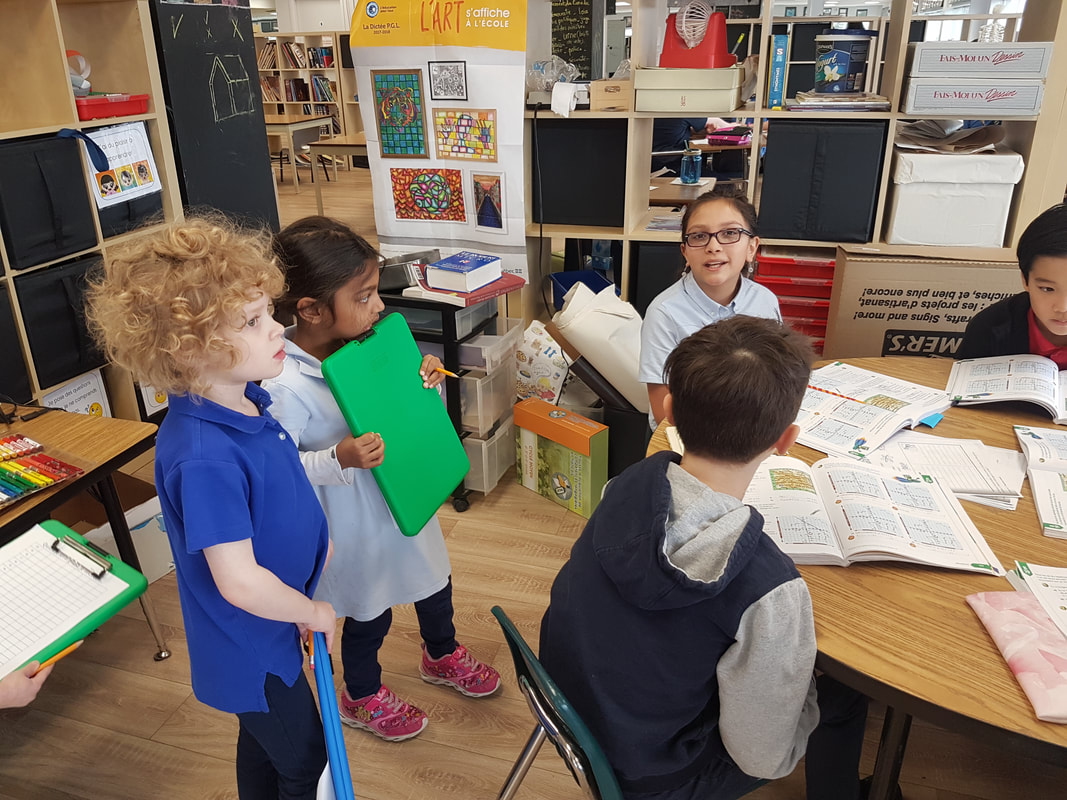
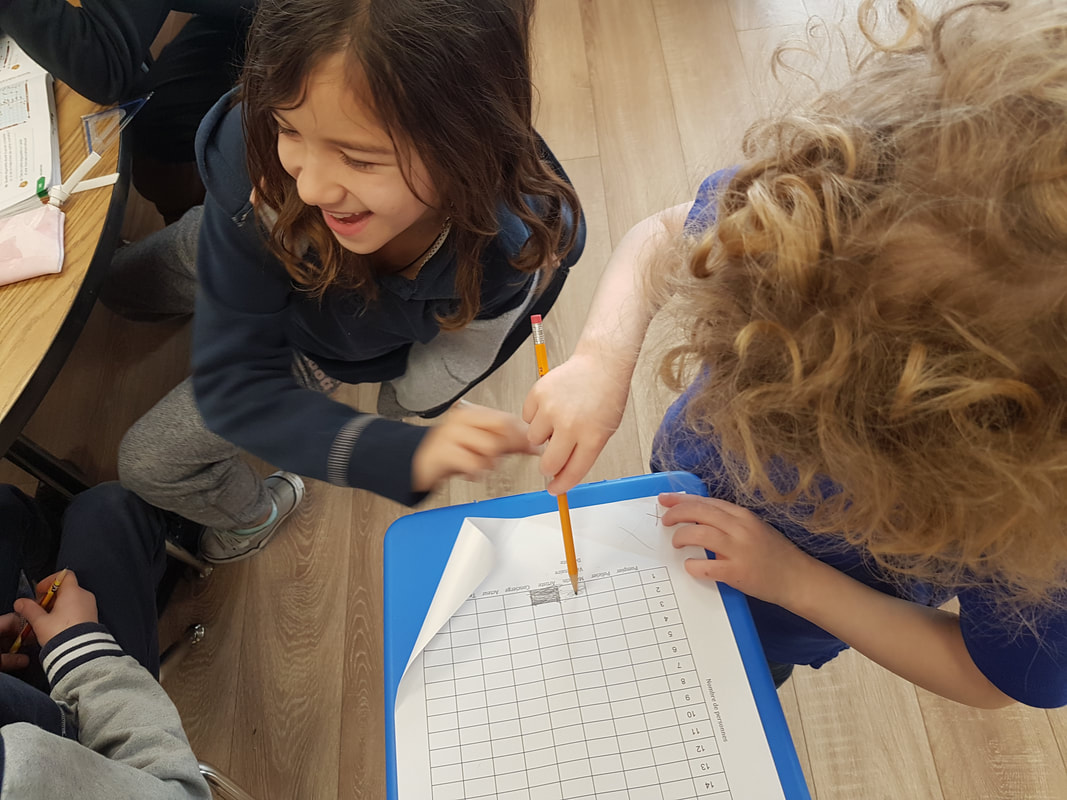
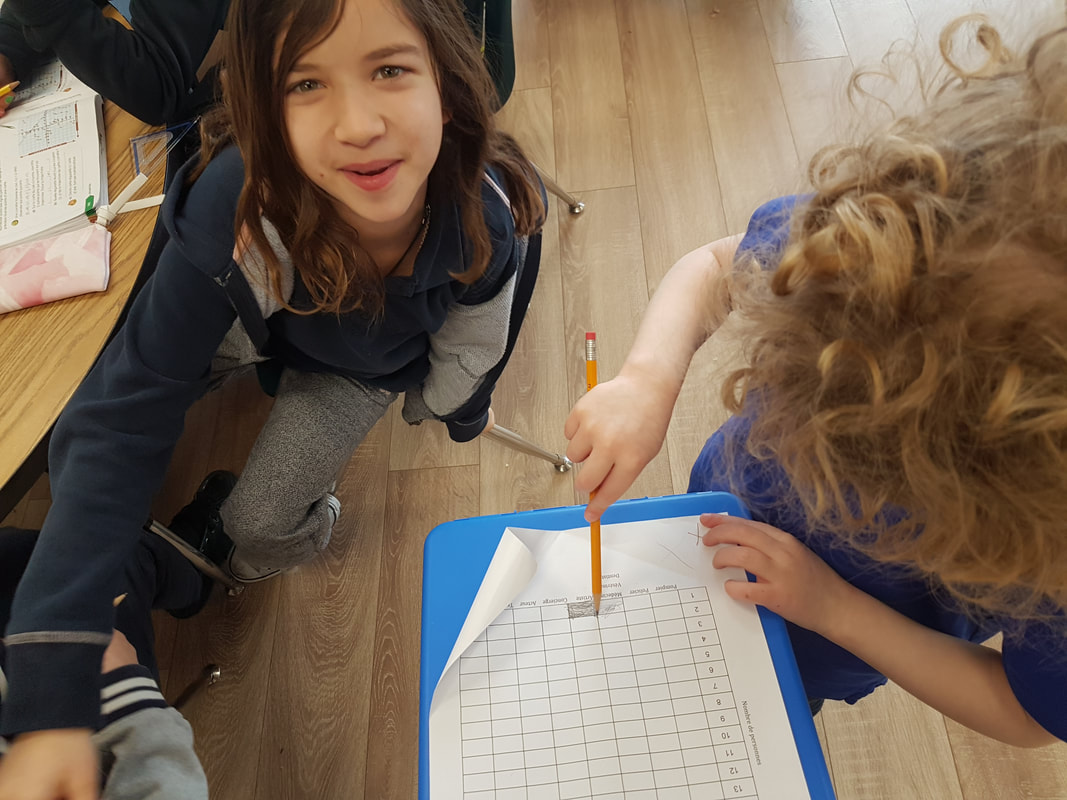
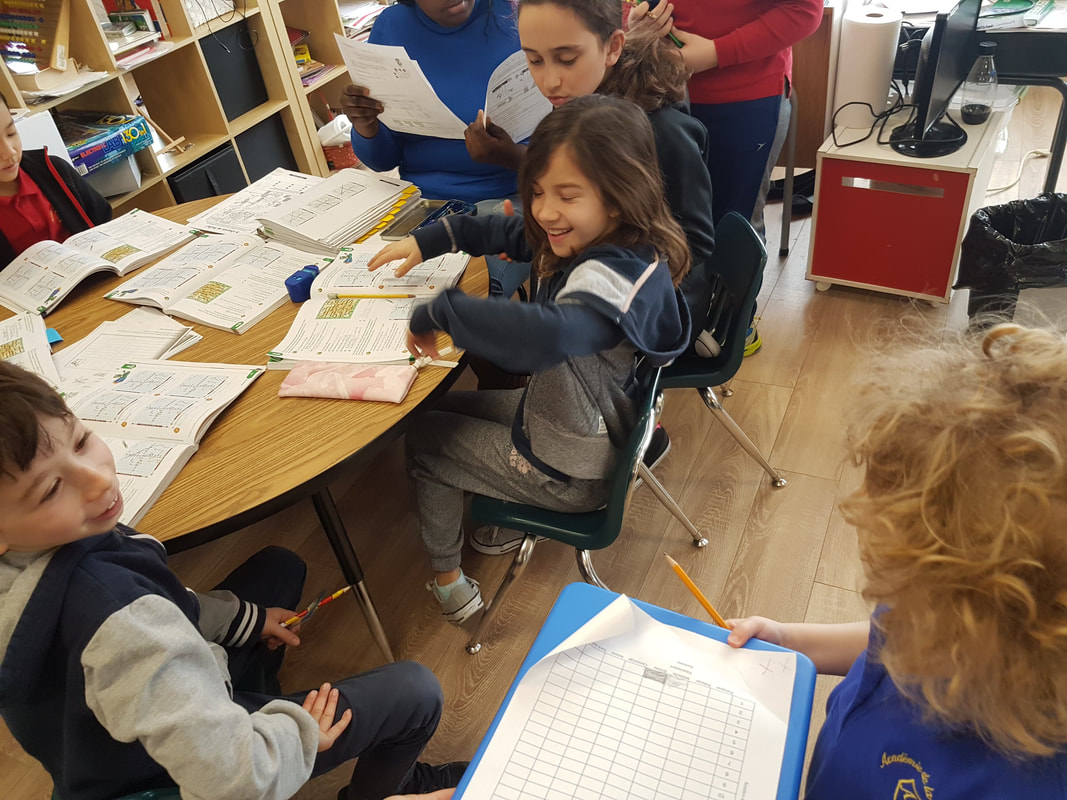
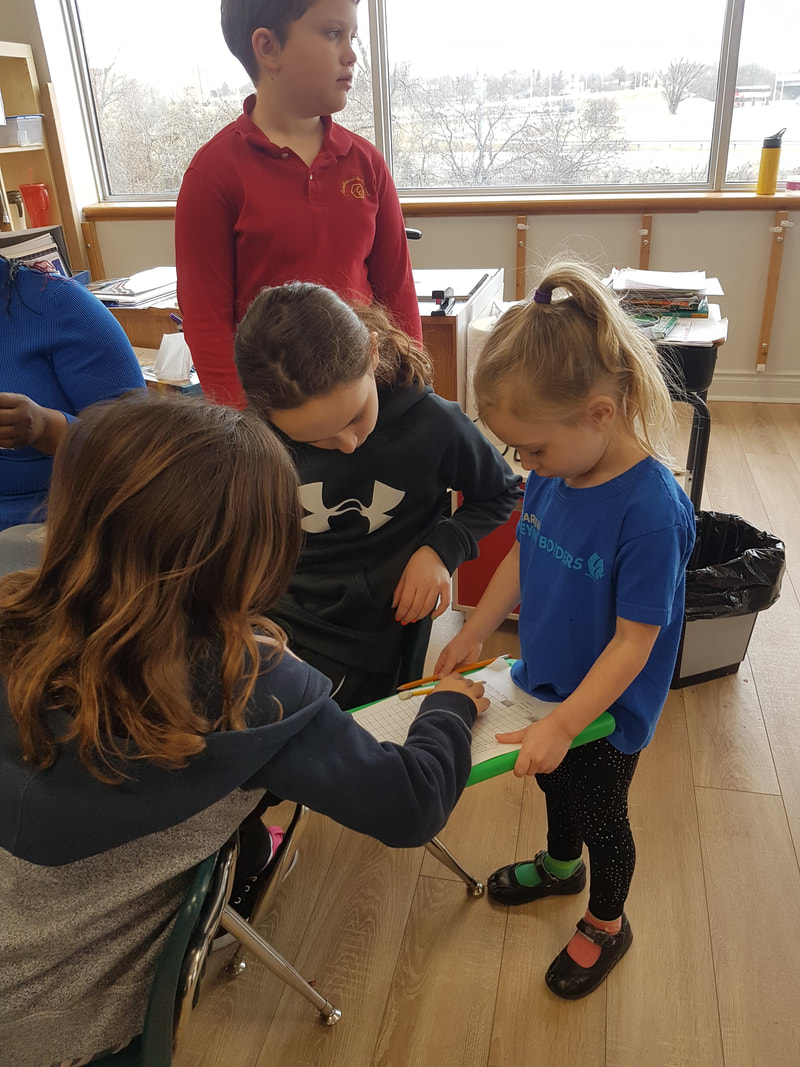
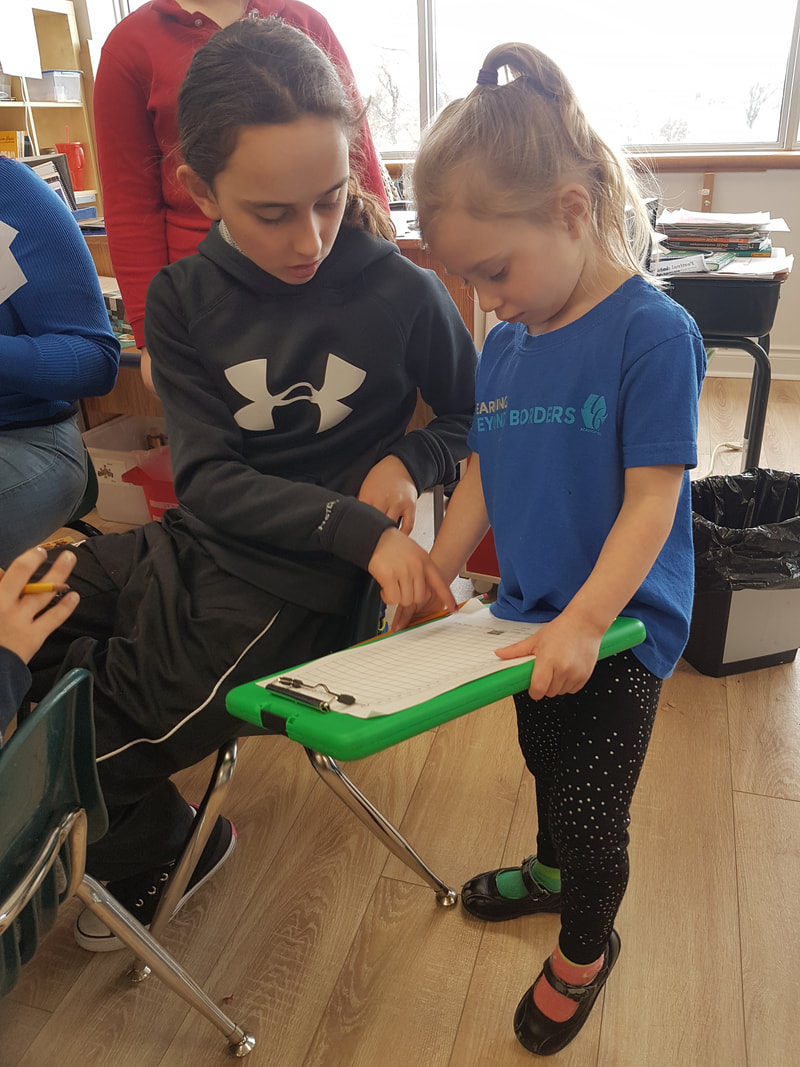
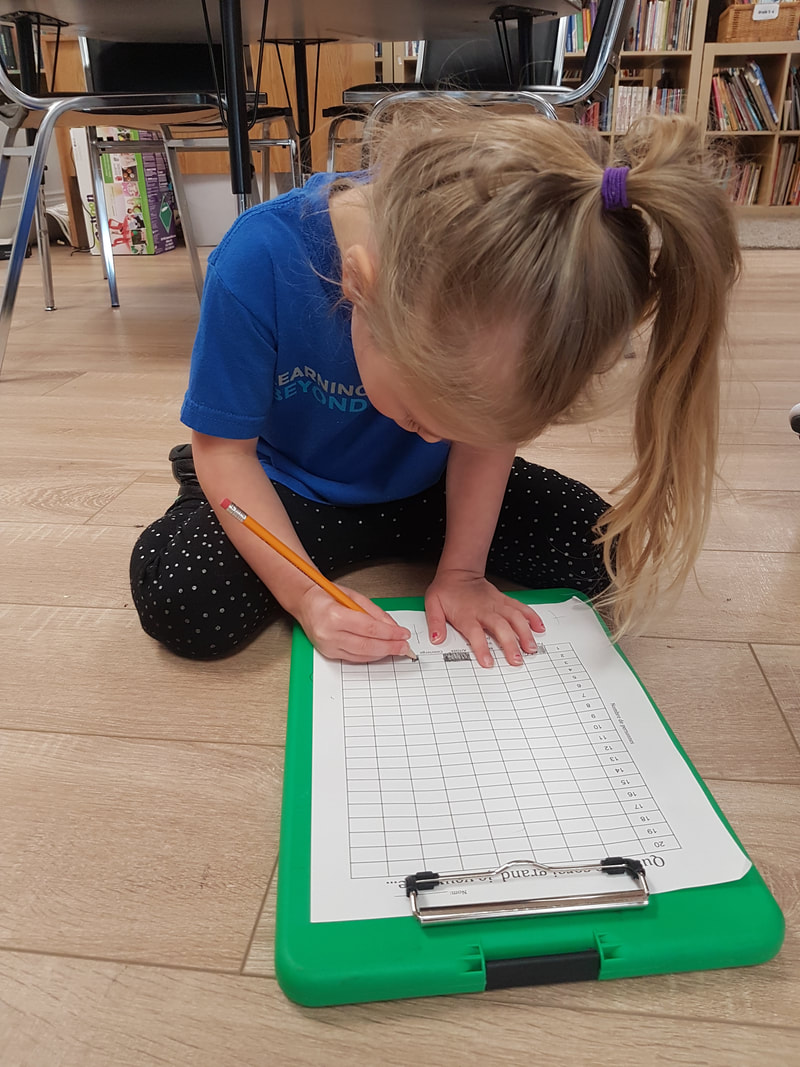
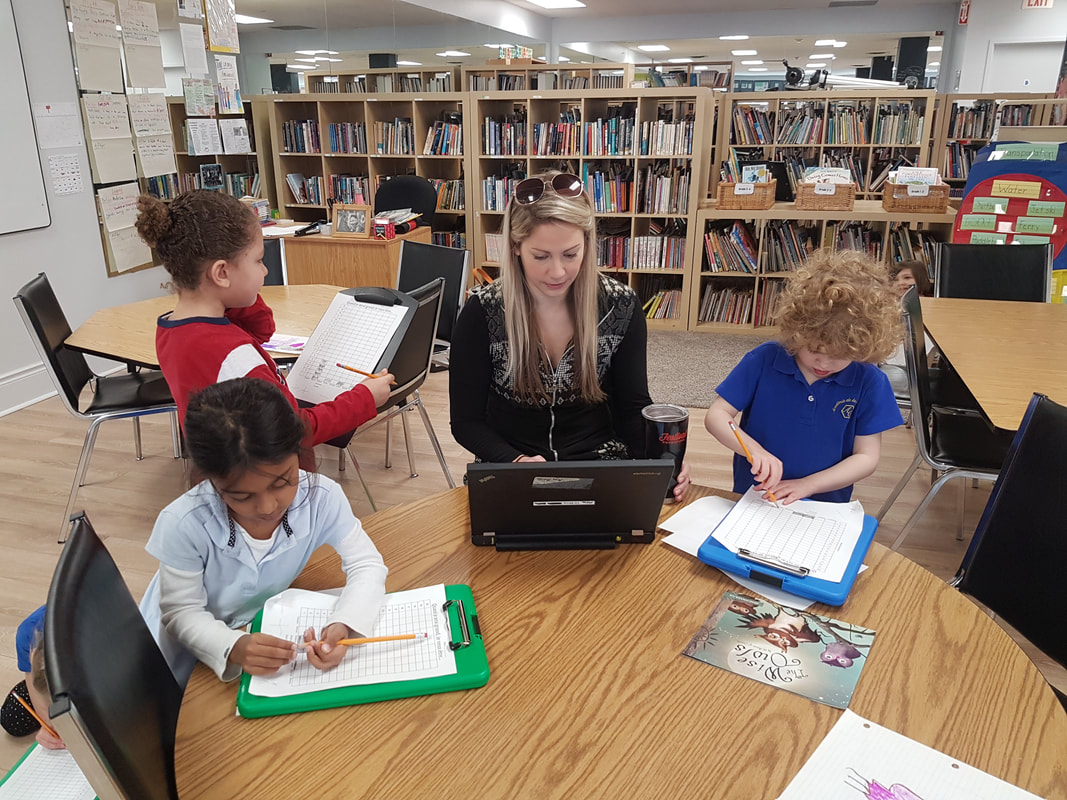
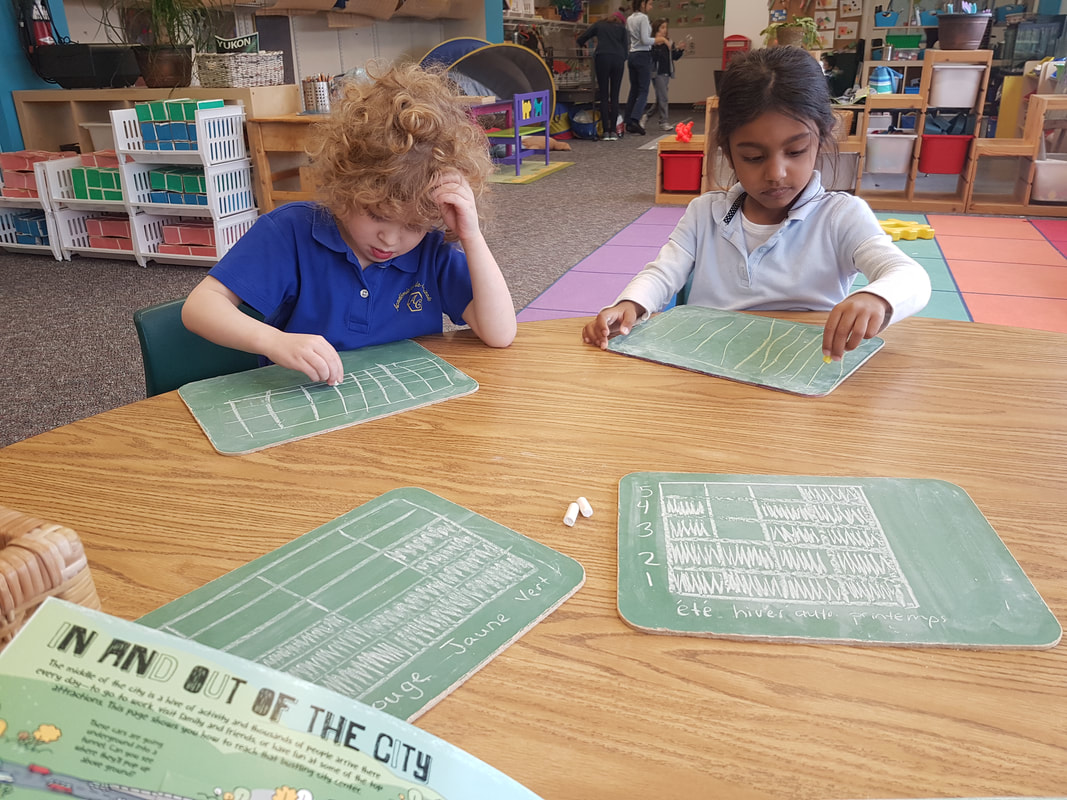
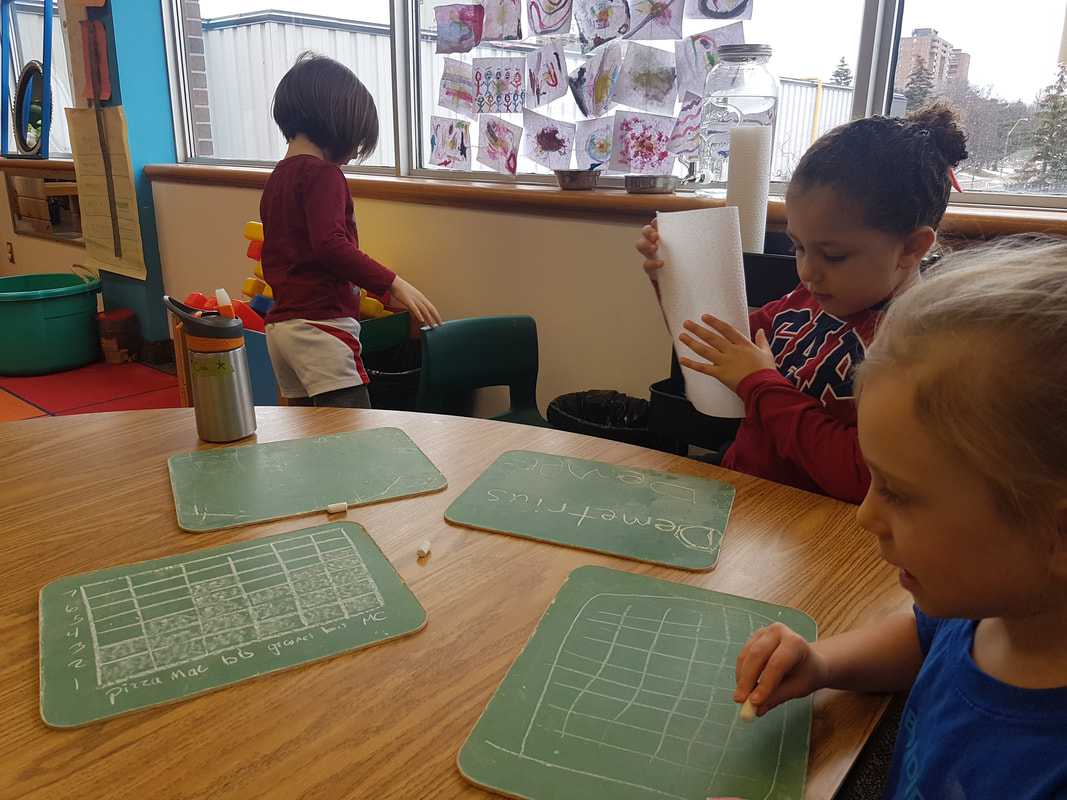
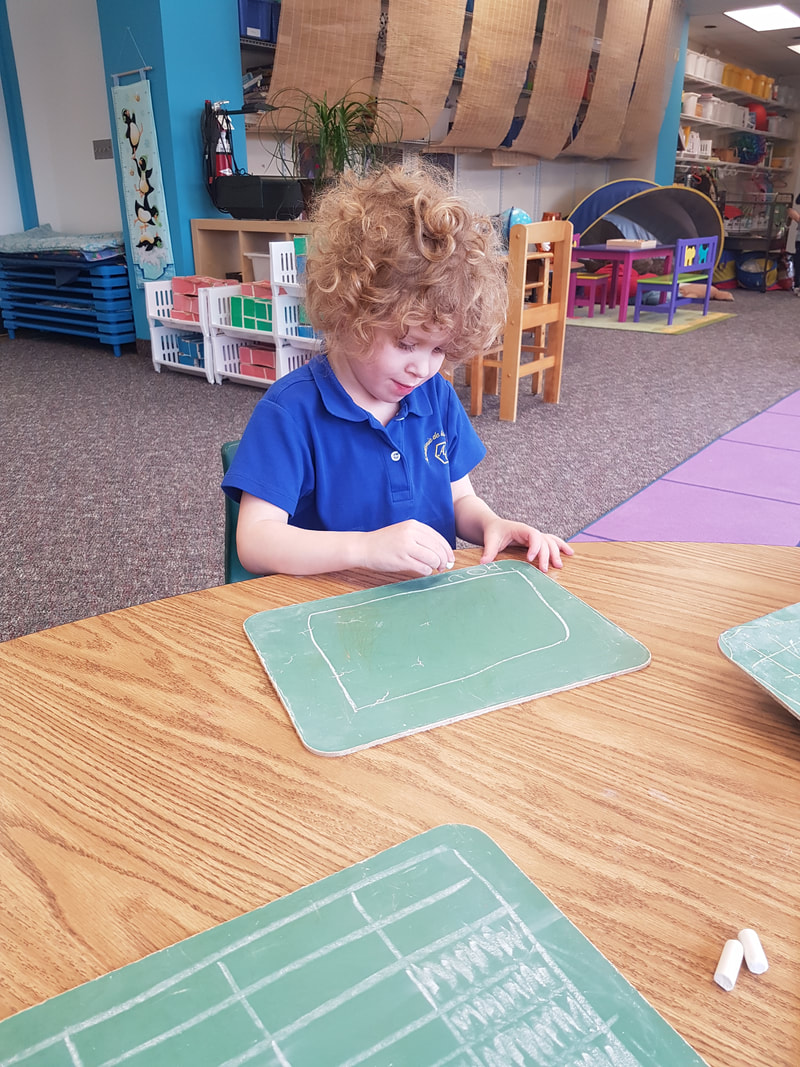
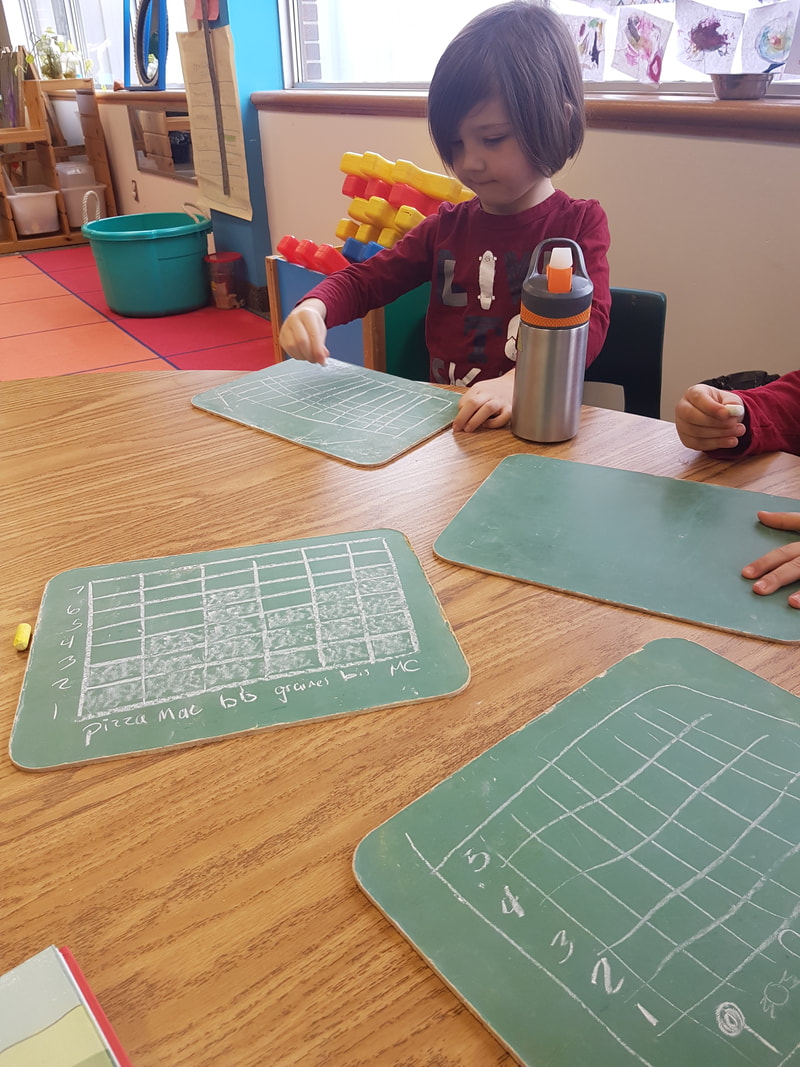
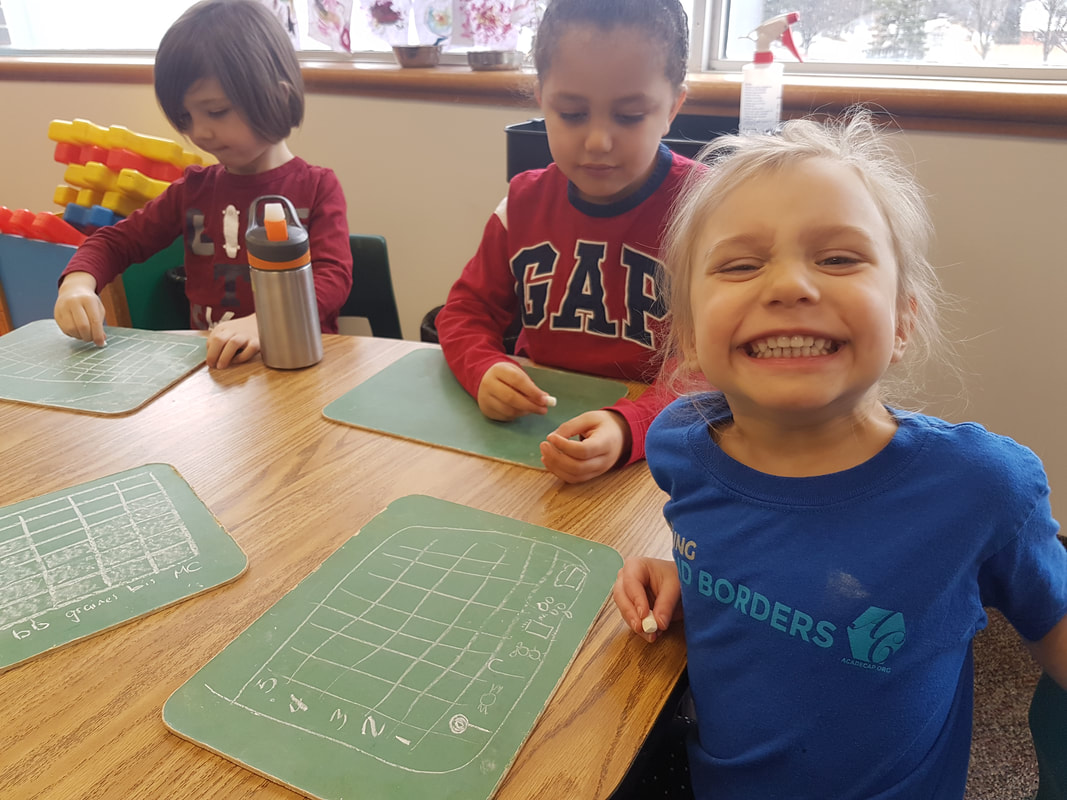
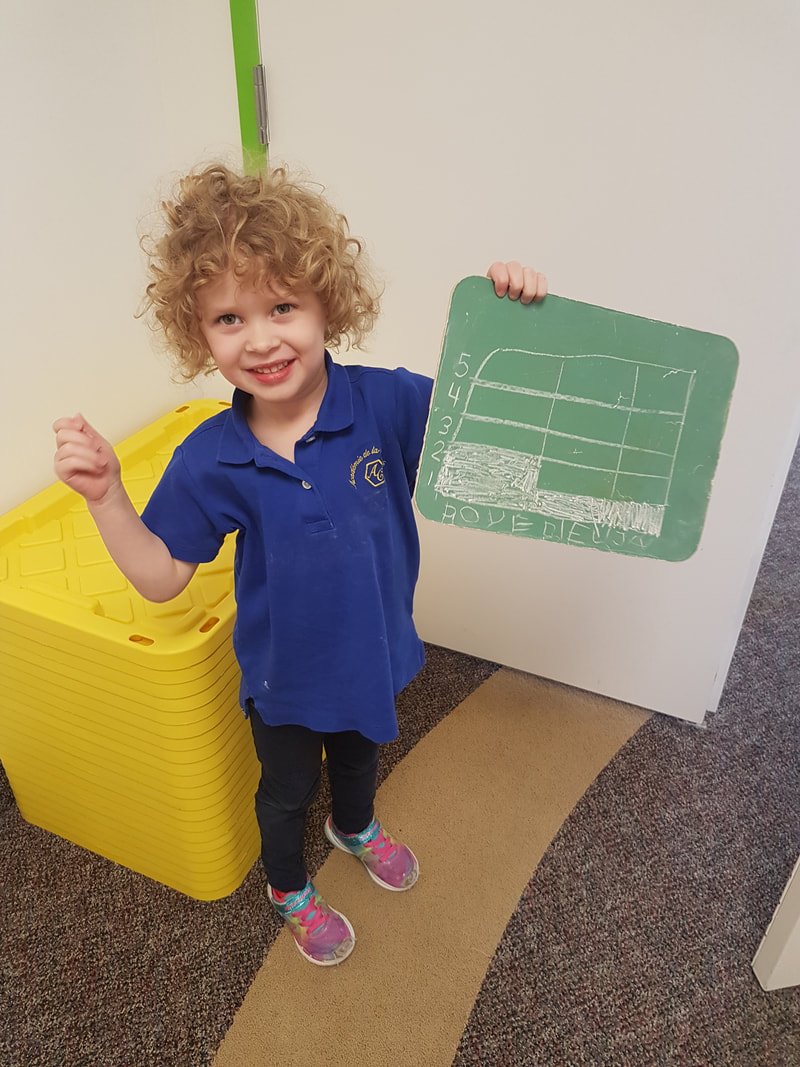
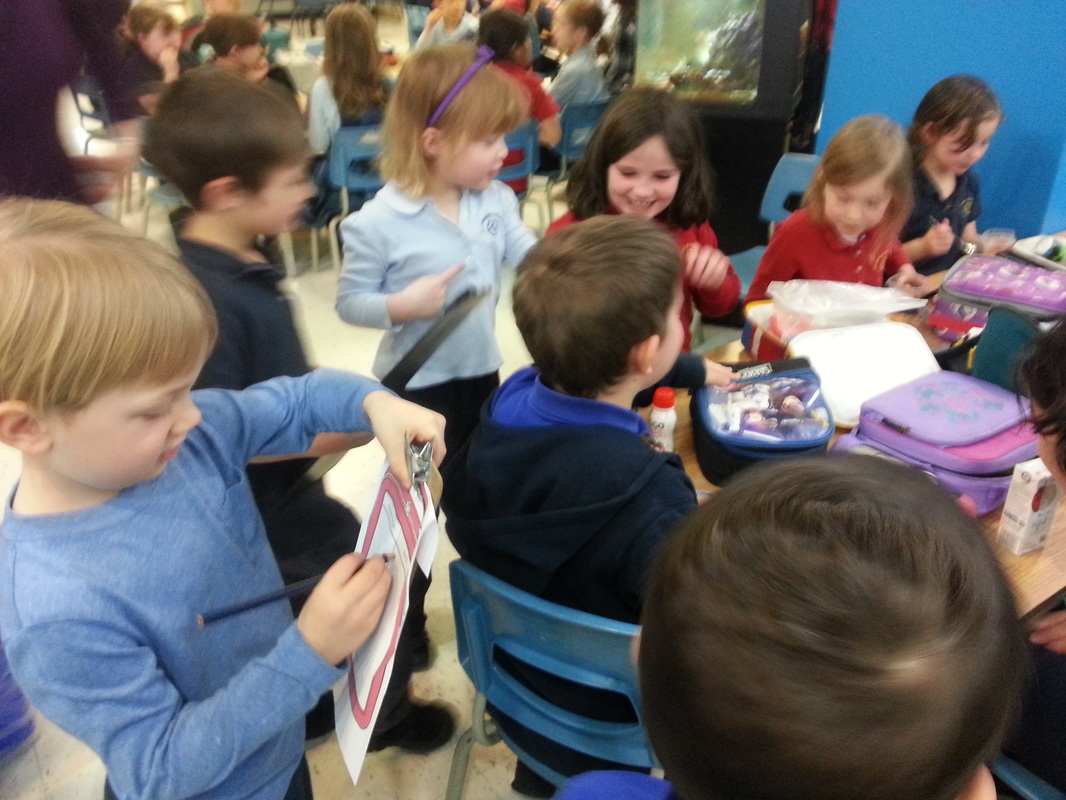
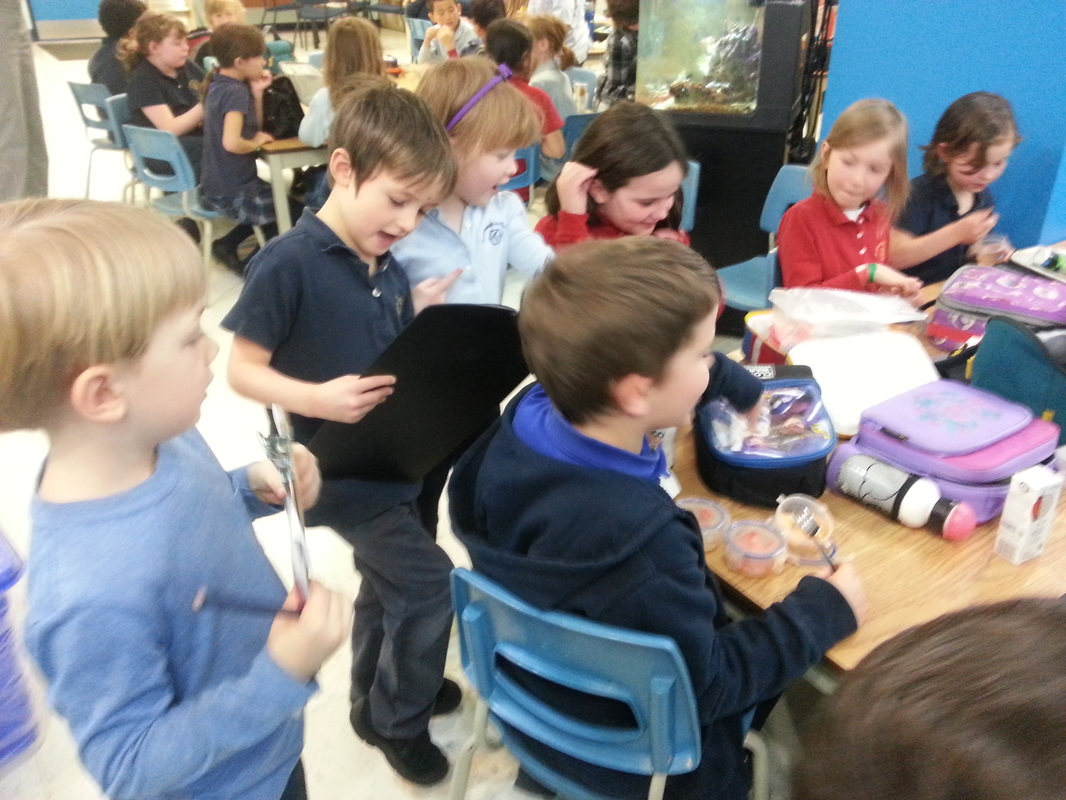
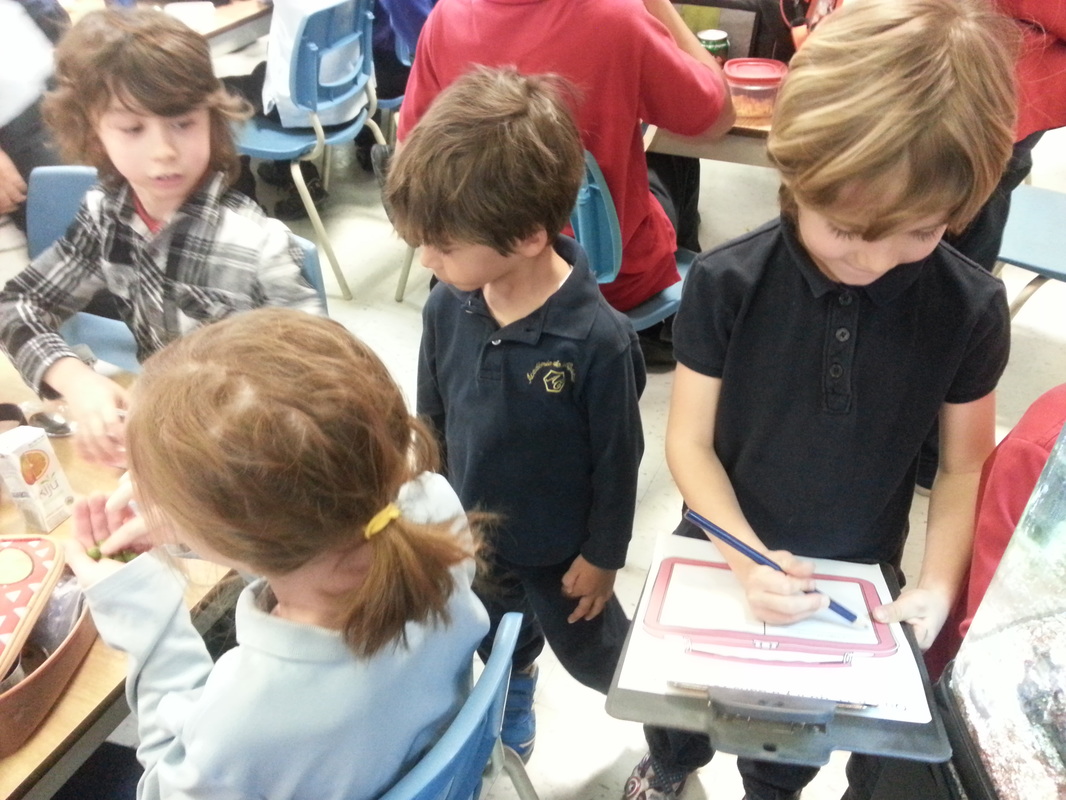
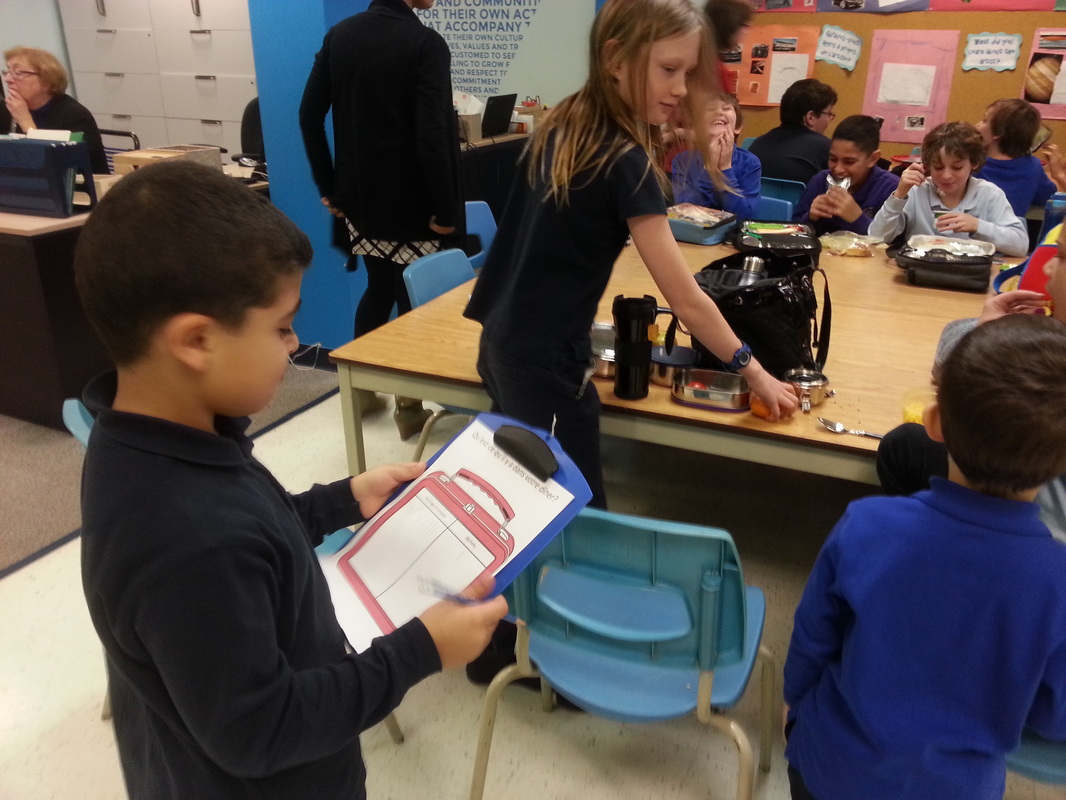
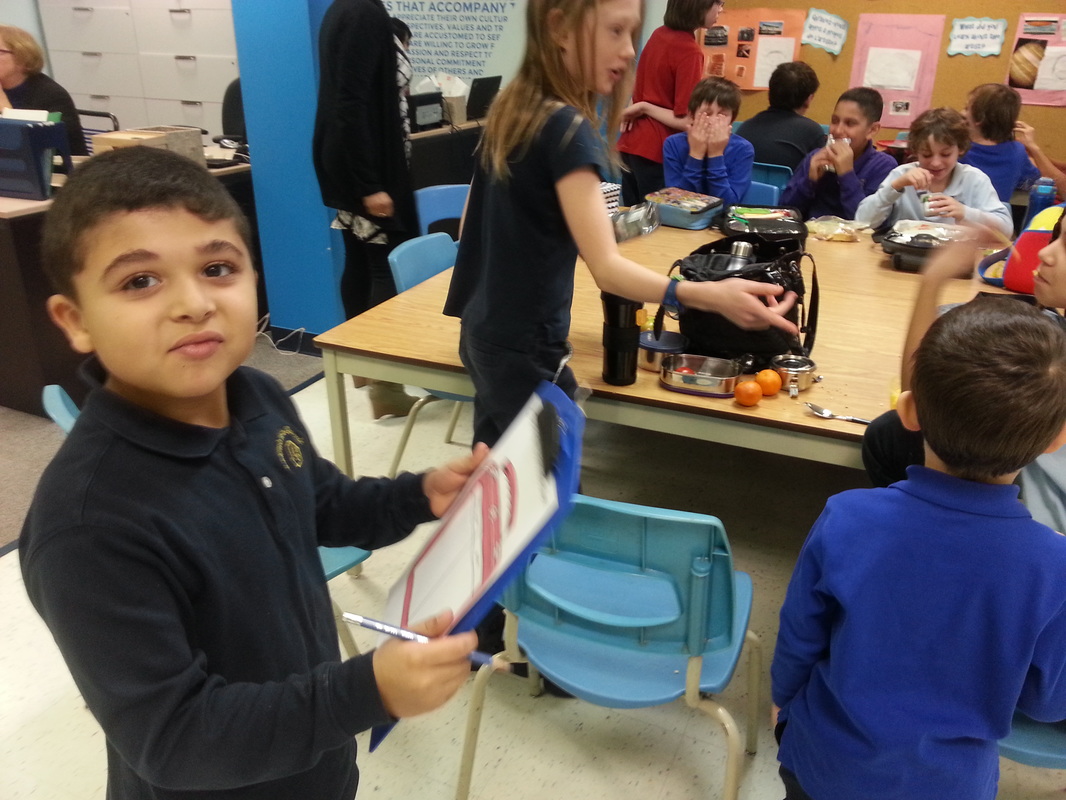
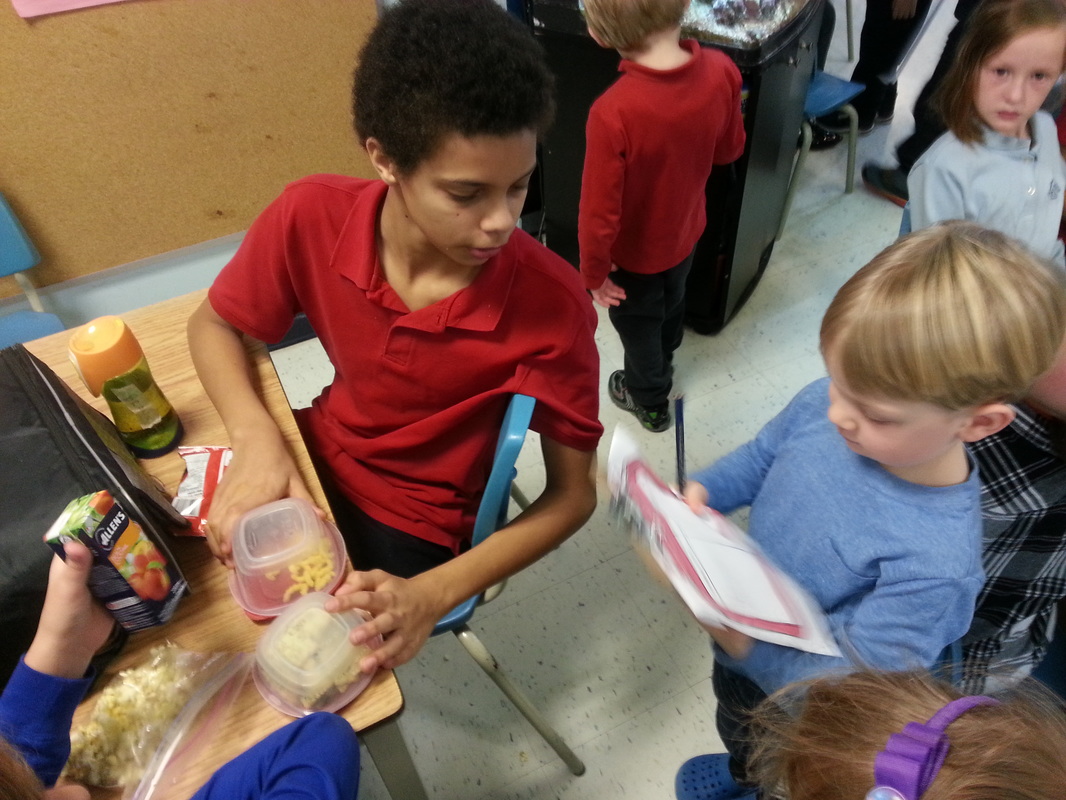
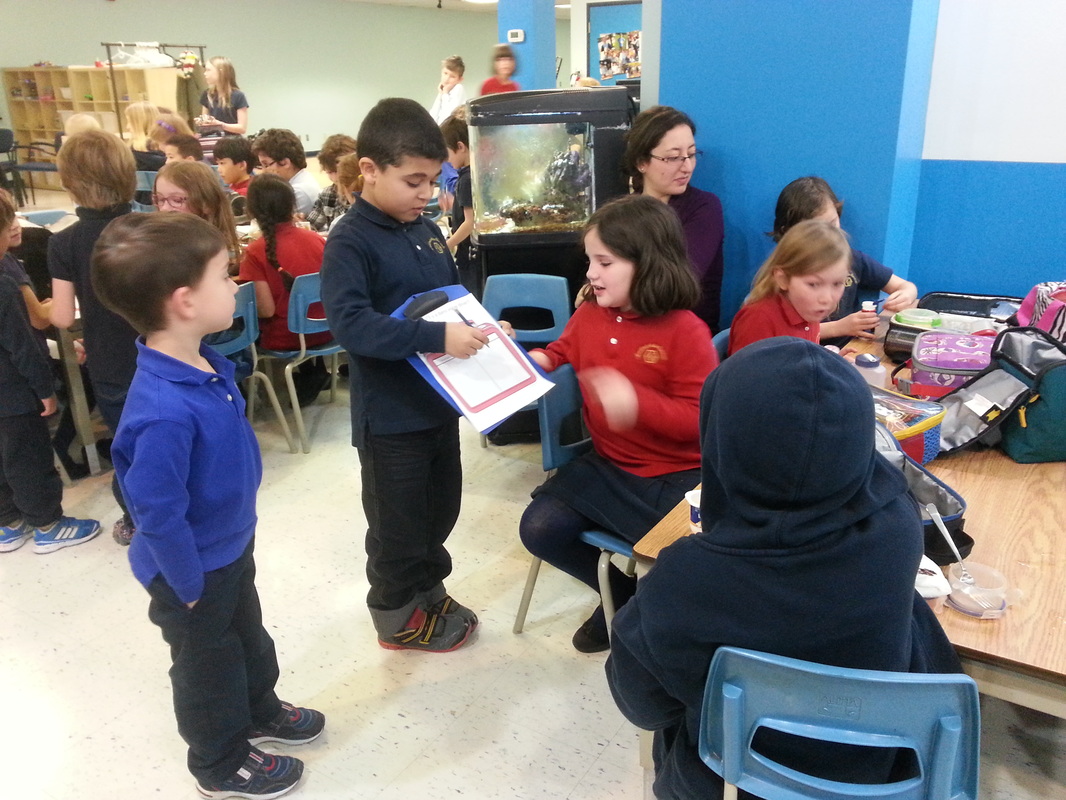
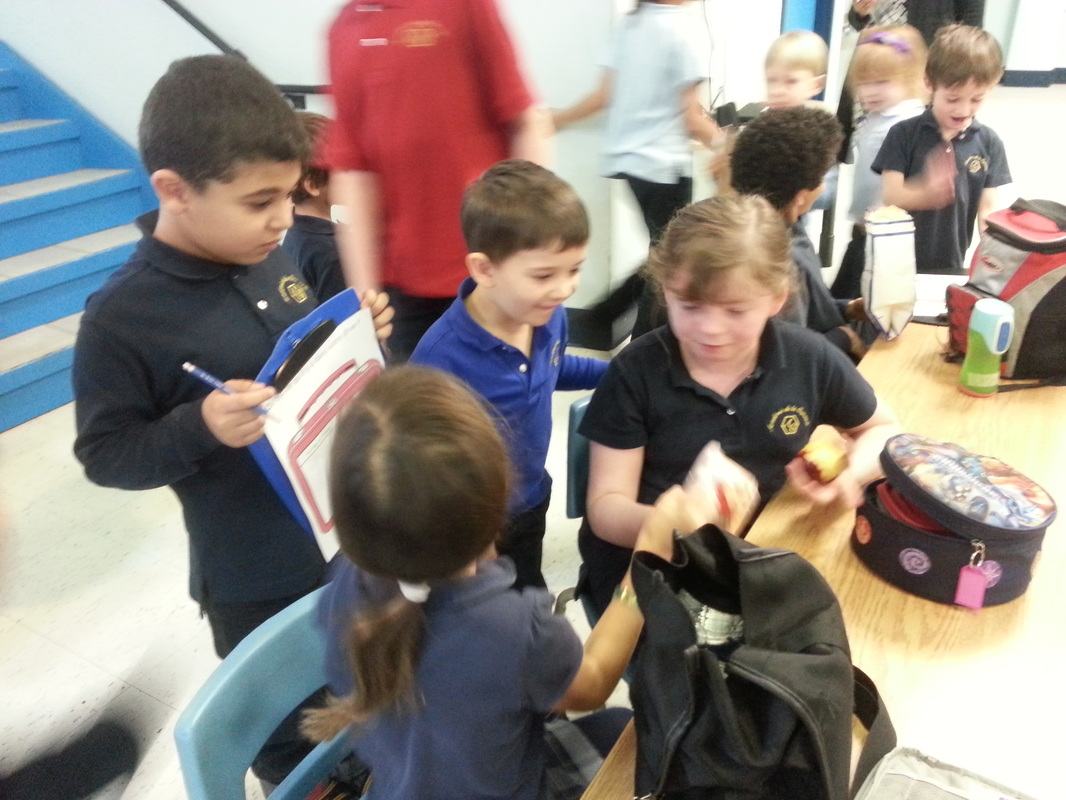
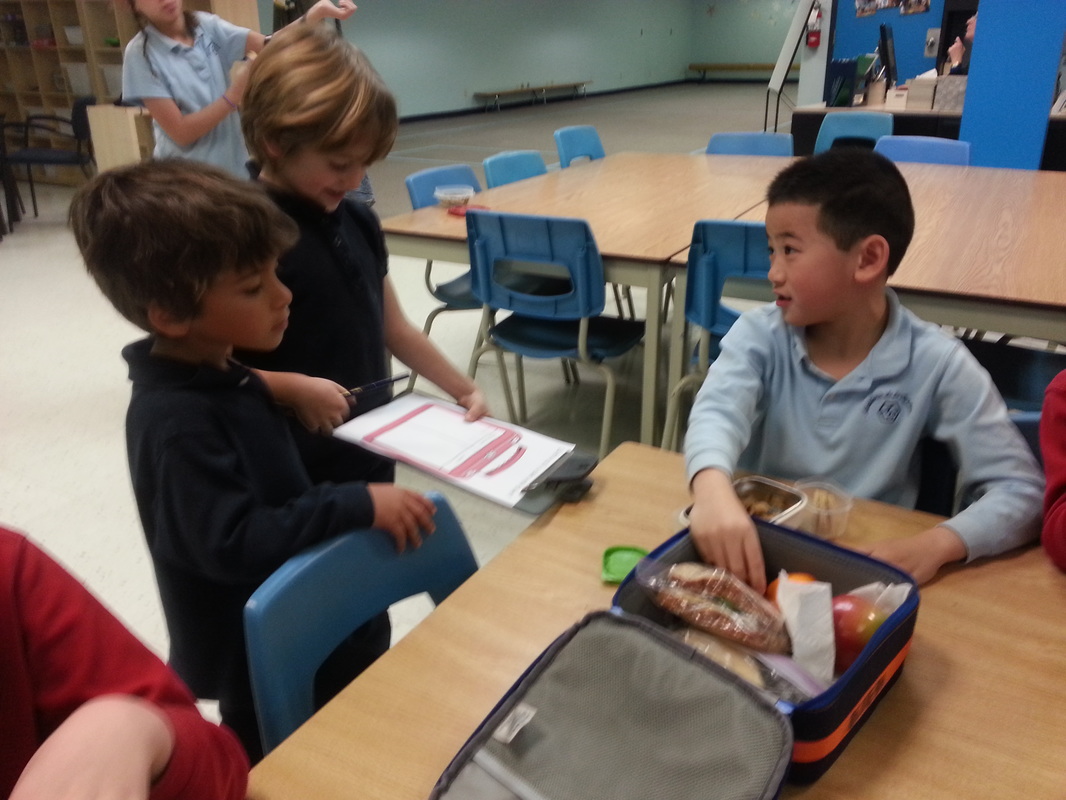
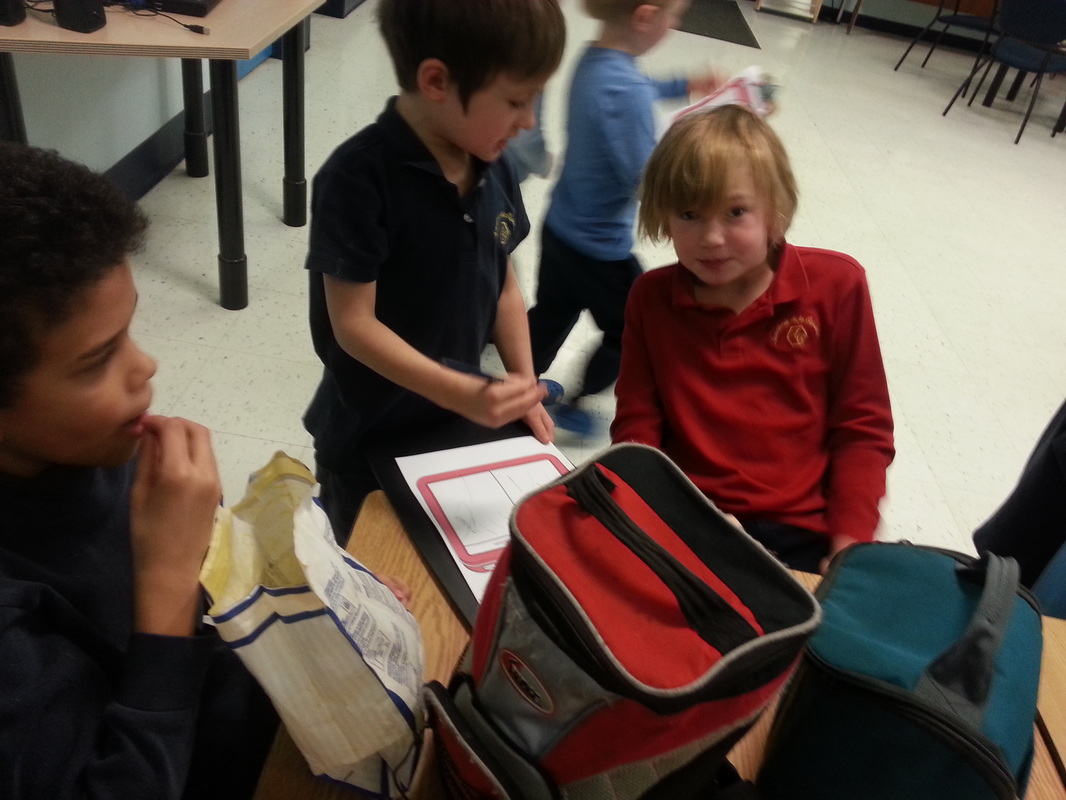
The JK students came up with a list of possible jobs of people in a community and using what they came up with, I created a form that they would use to get information from their school mates as to what they wanted to be when they grew up. If what they wanted to be was not on the list, the JK kids made an X on the bottom of the page to represent 'other'. So we went around the school and gathered all the information we could before going back to class and making one main graph to represent all the info we got. We found that there were many community jobs that we had not come up with! Later, we practiced making bar graphs and collecting info on our little chalk boards.
|
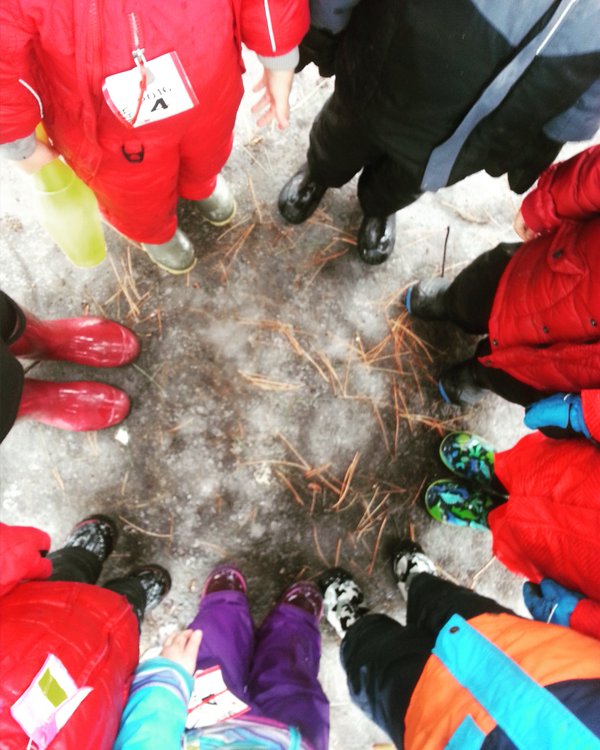
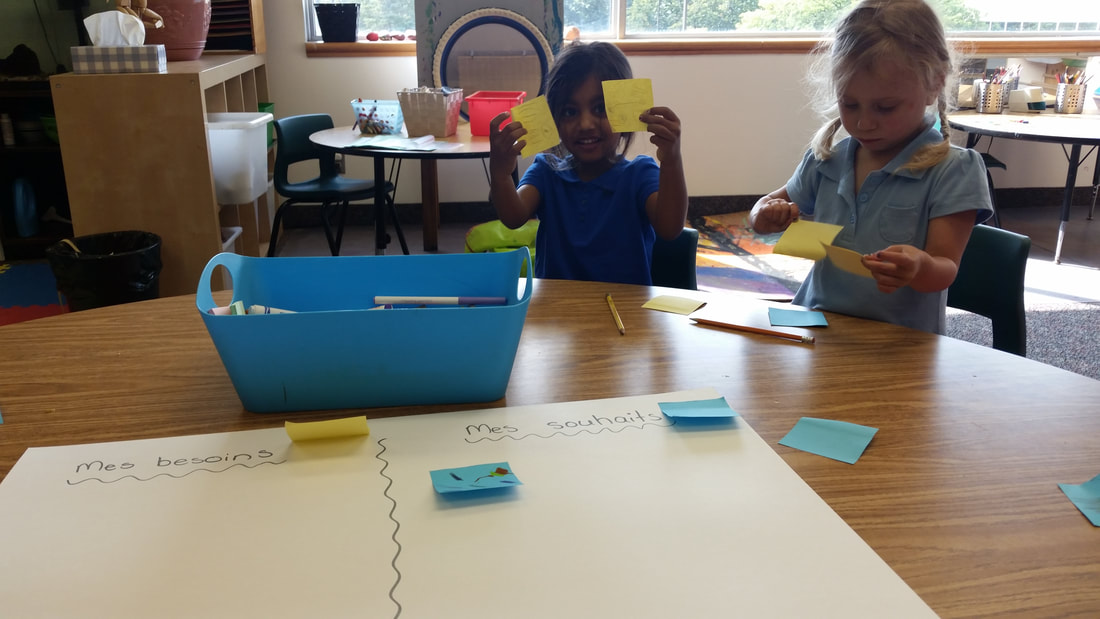
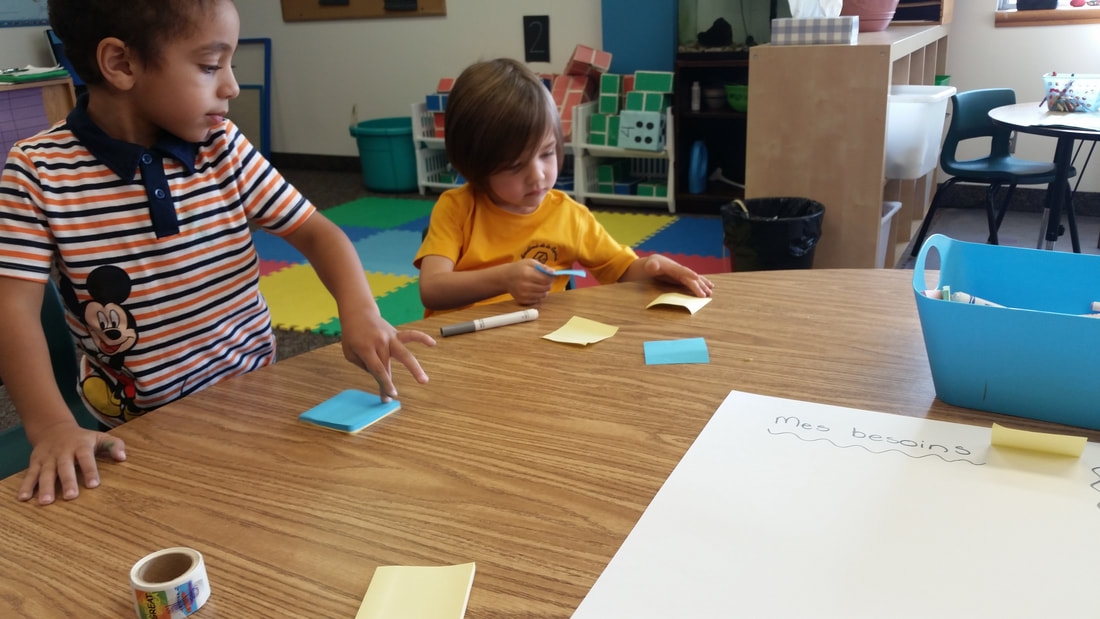
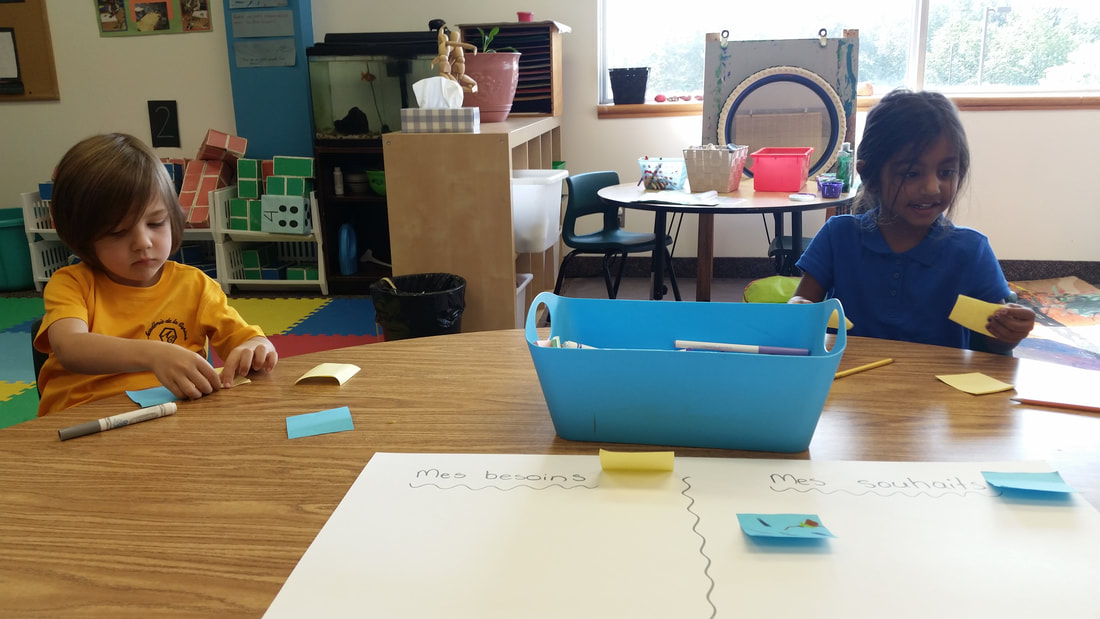
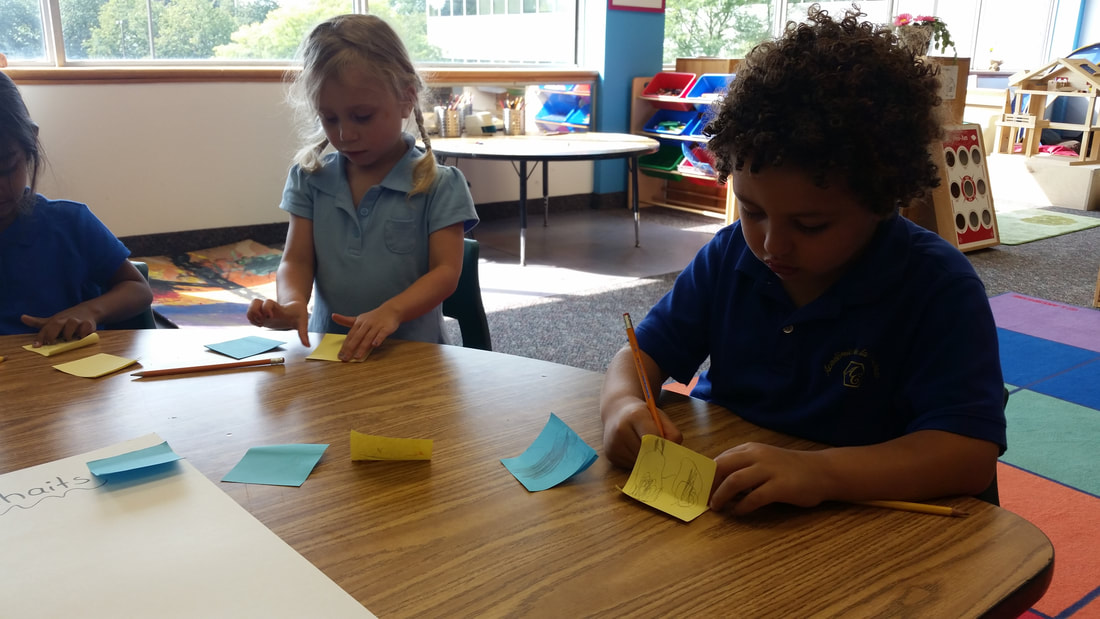
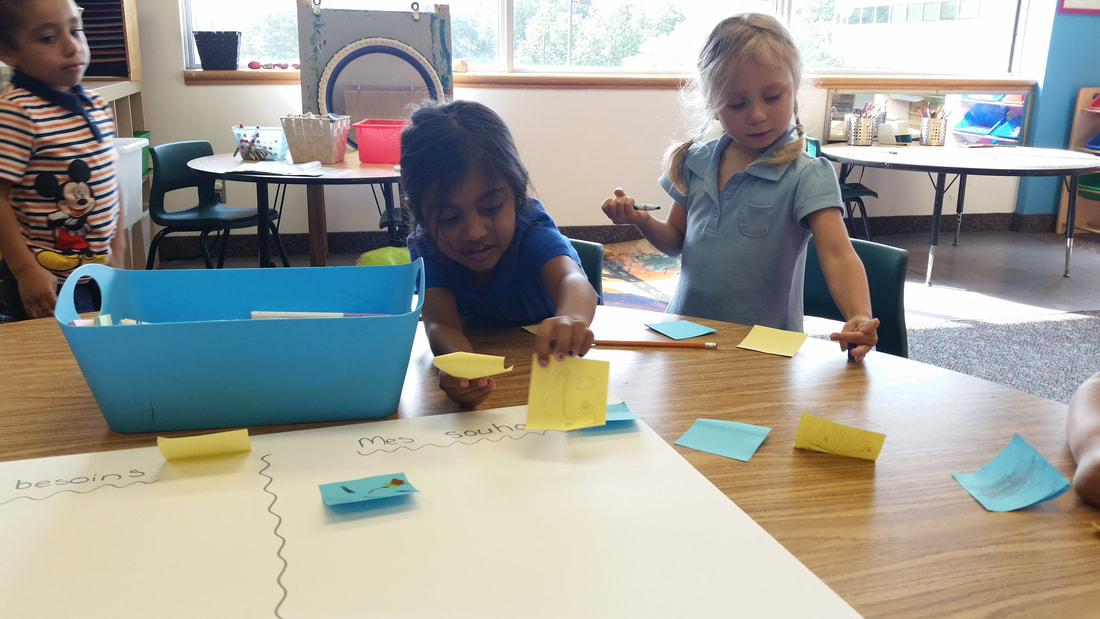
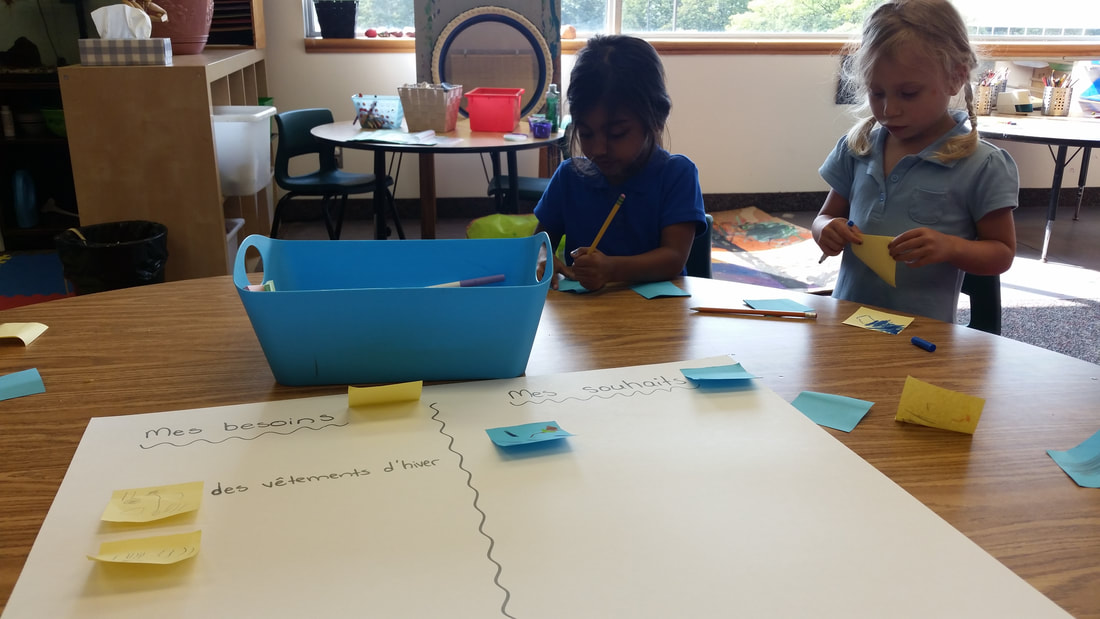
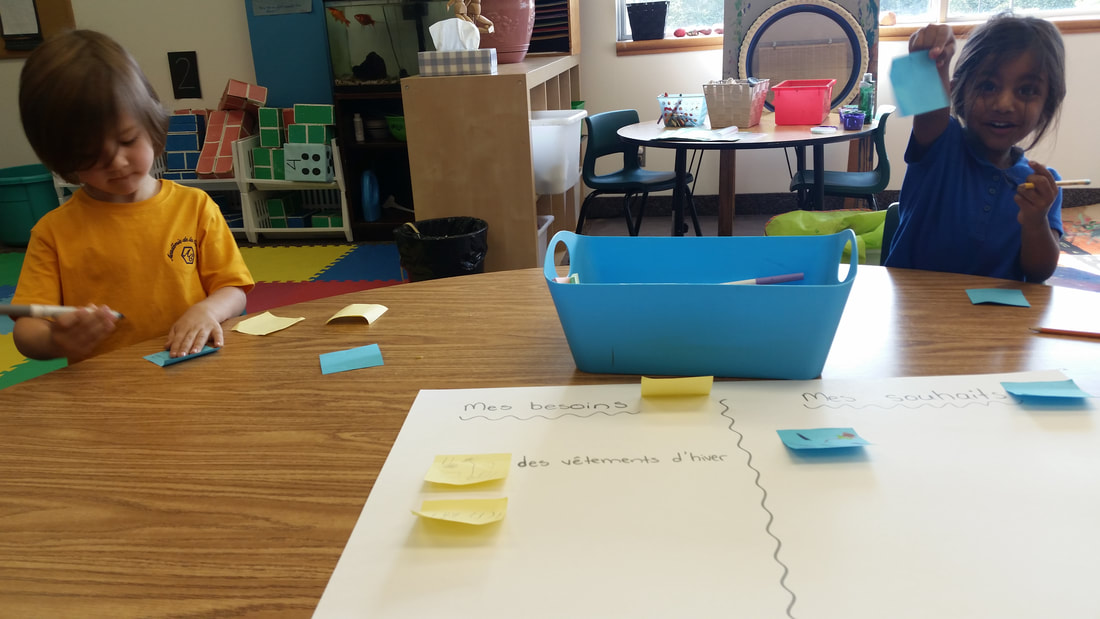
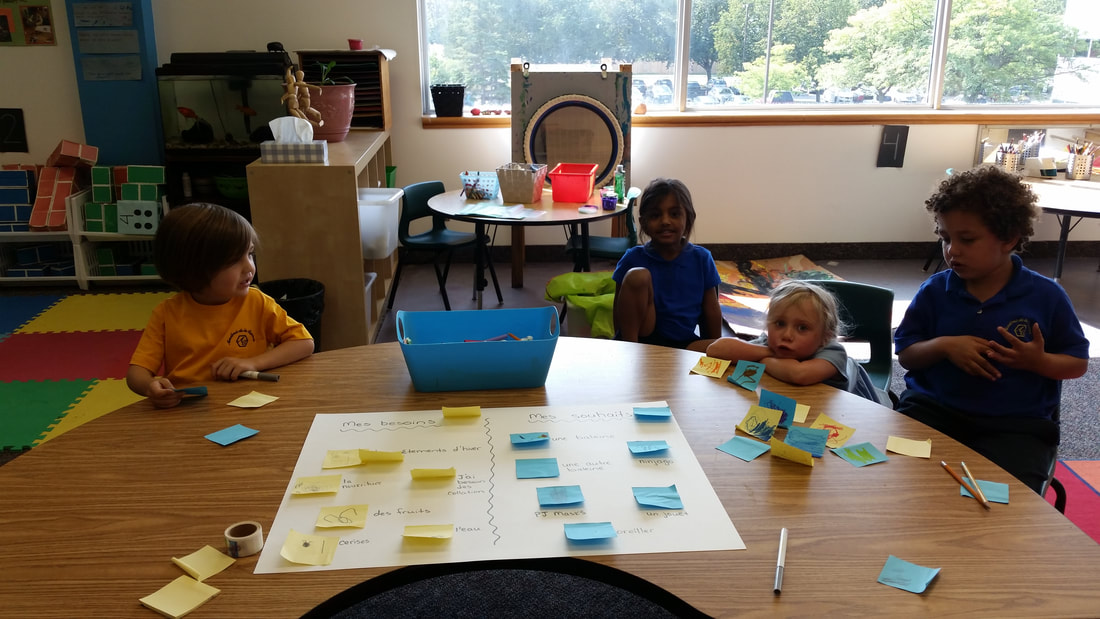
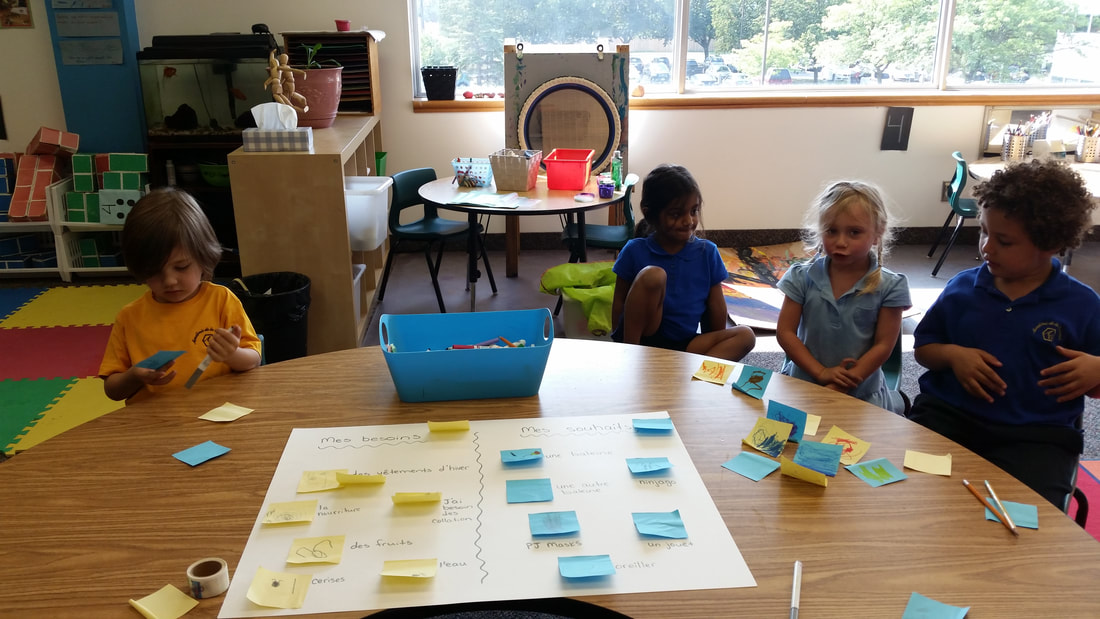
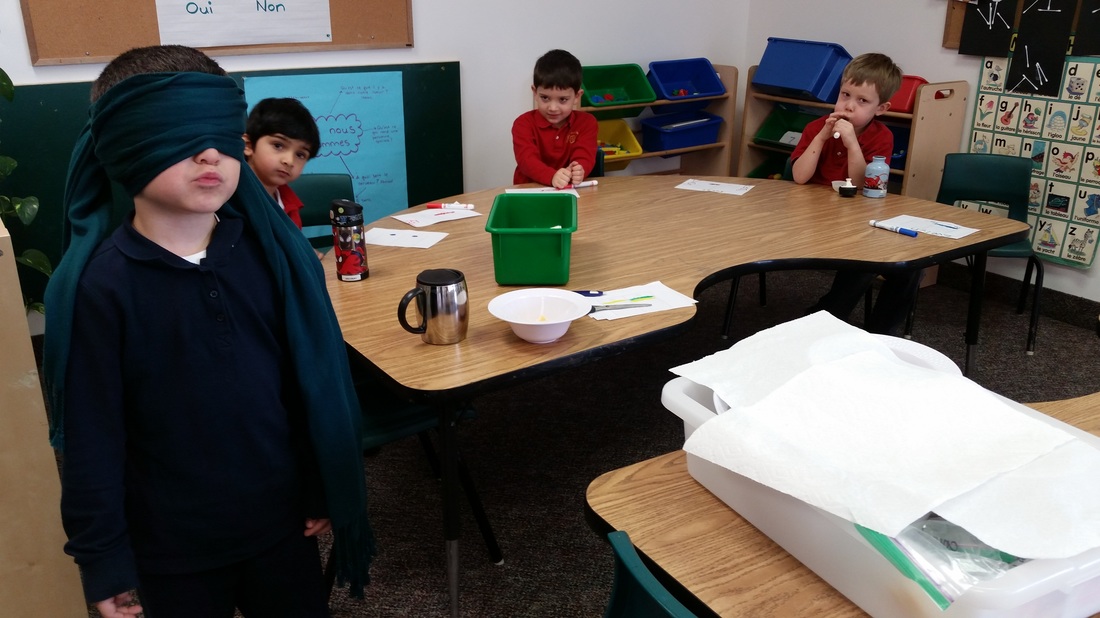
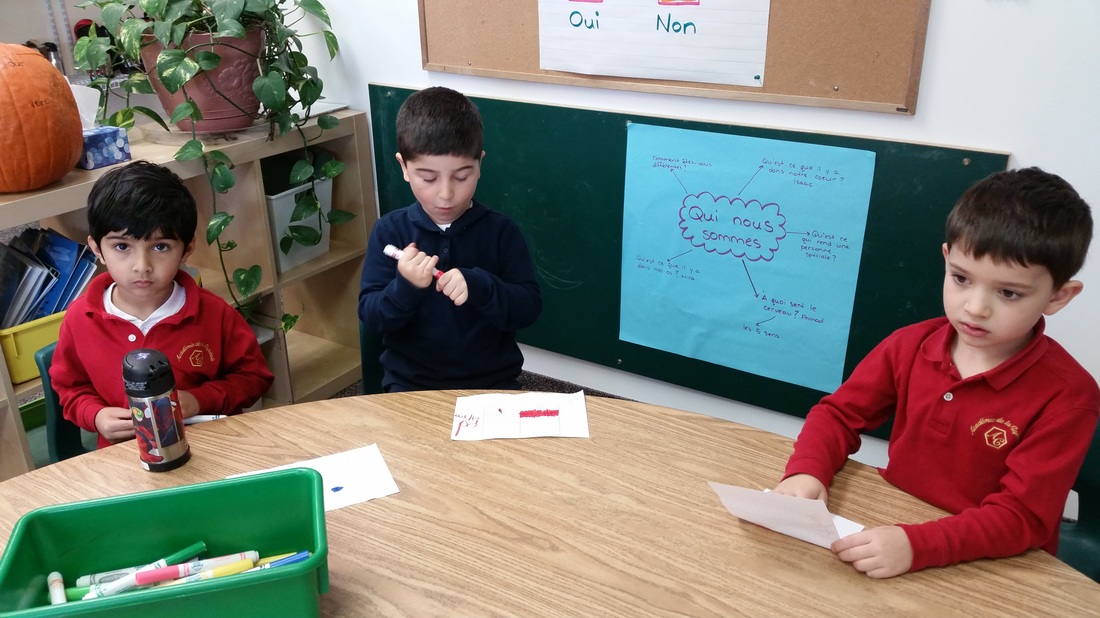
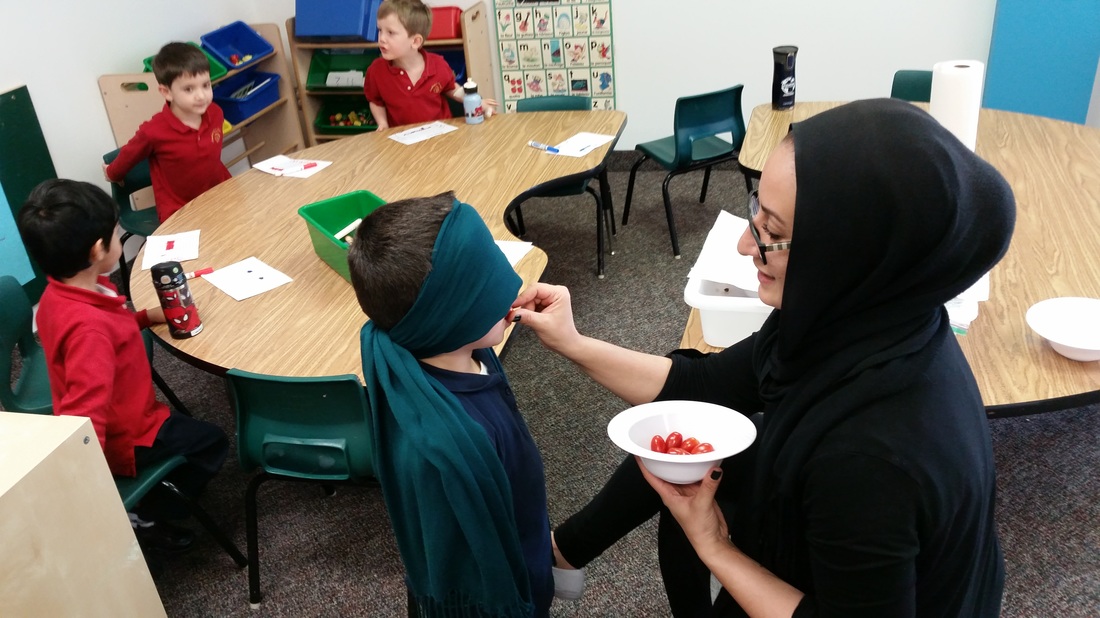
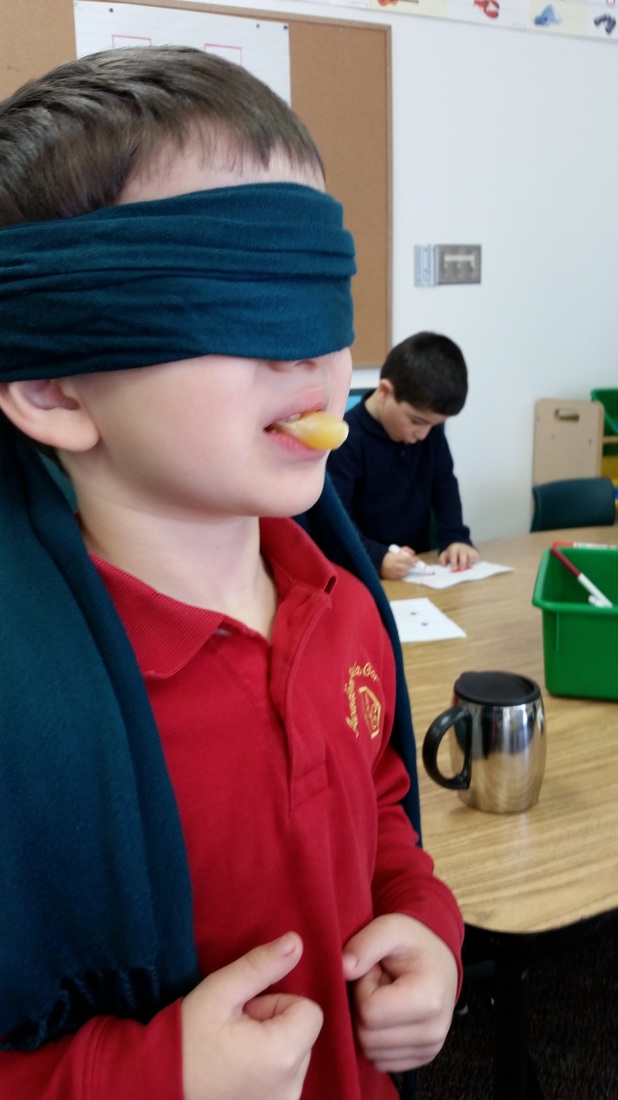
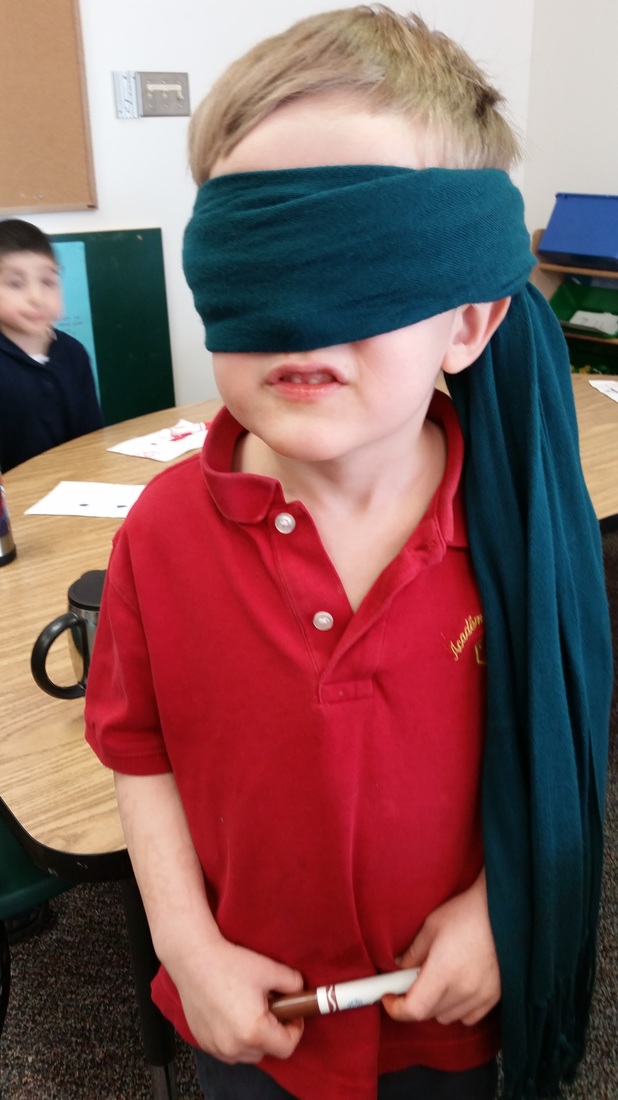
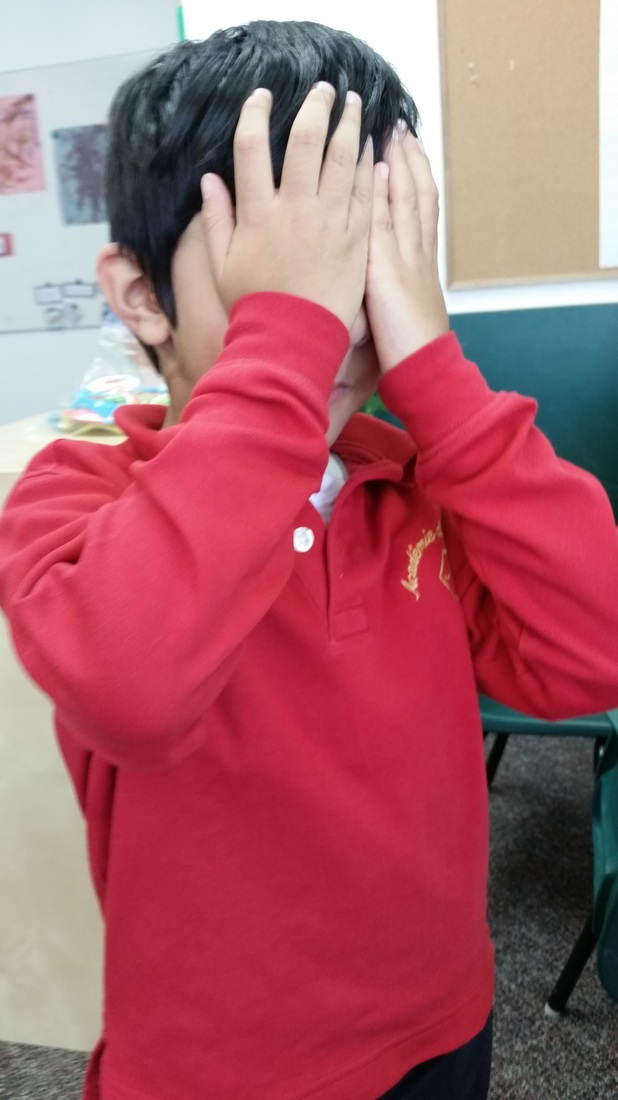
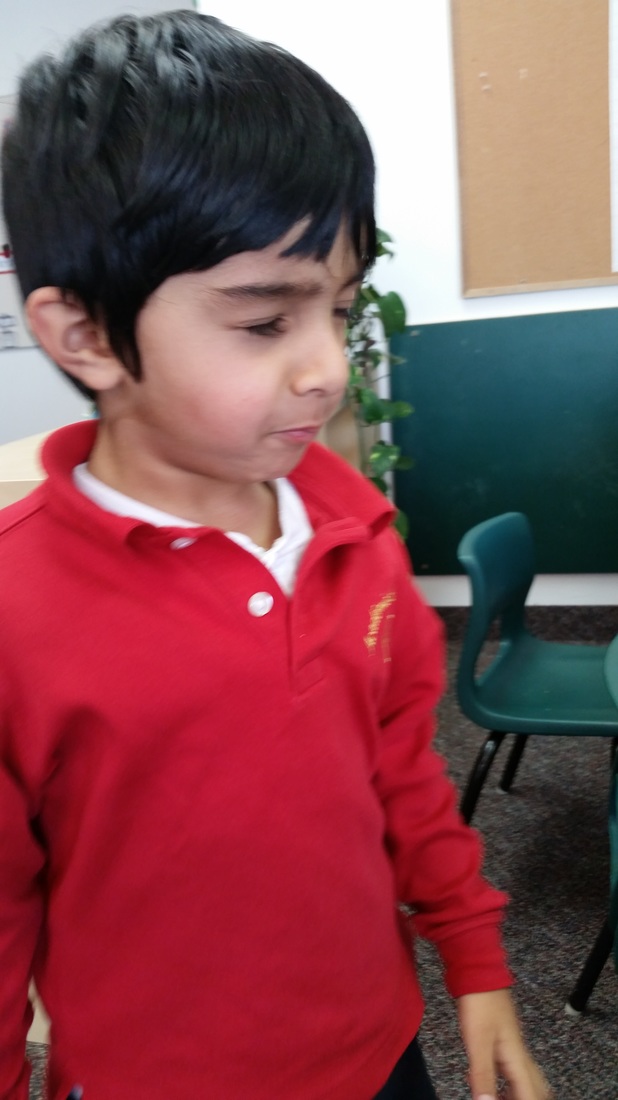
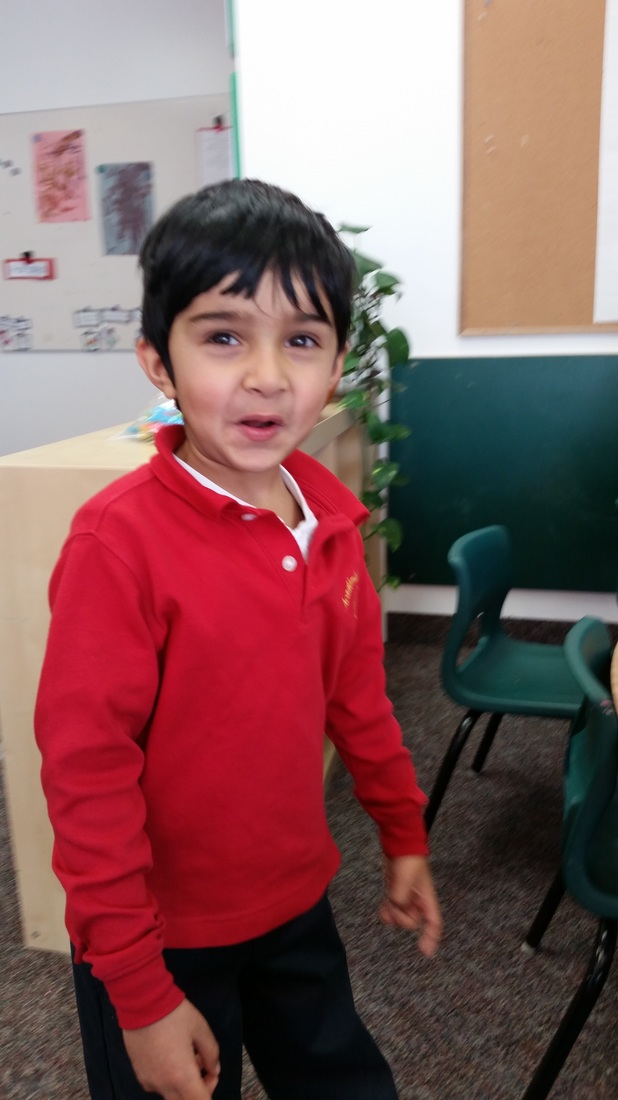
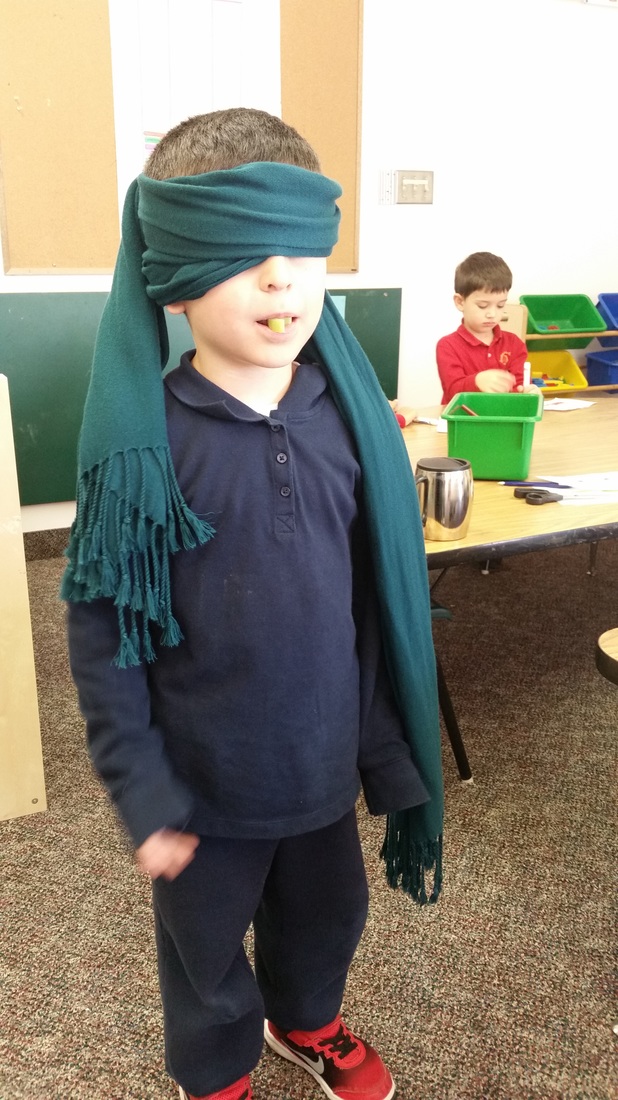
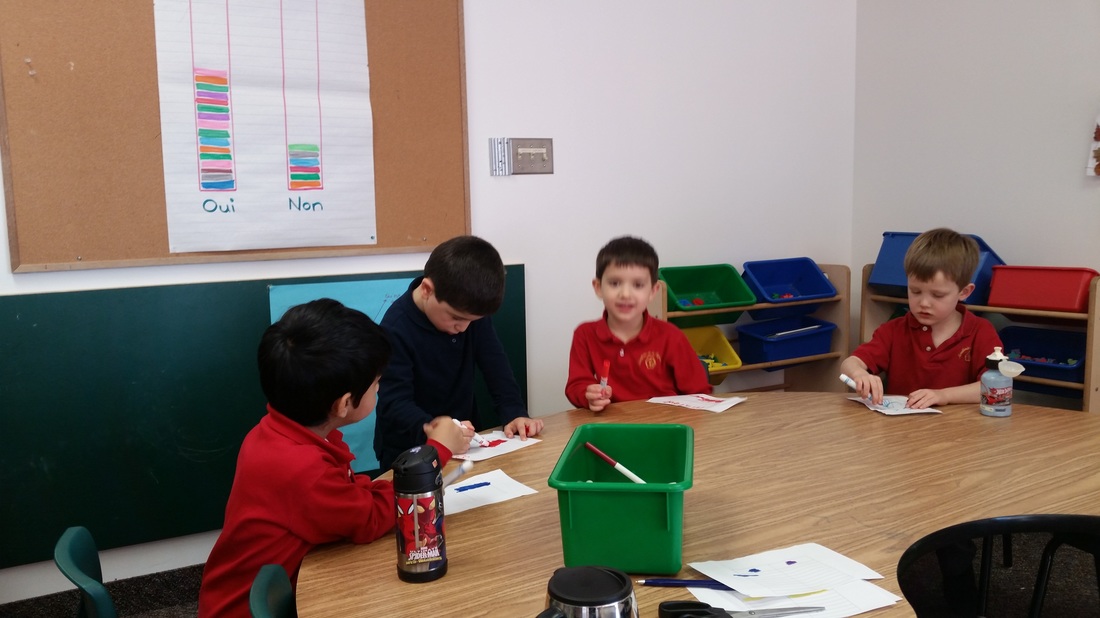
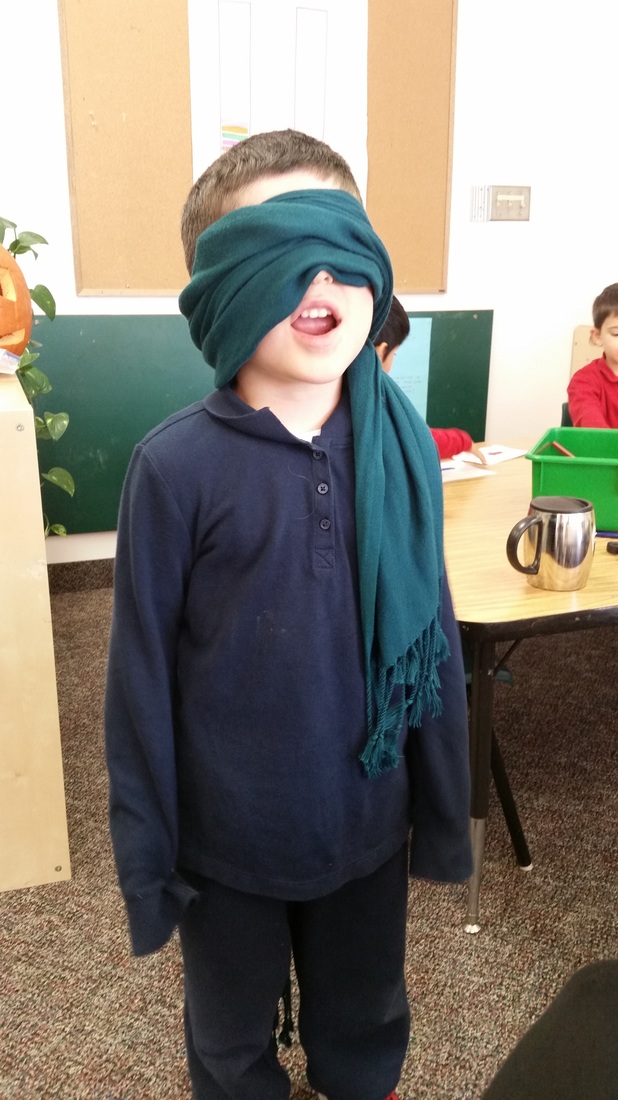
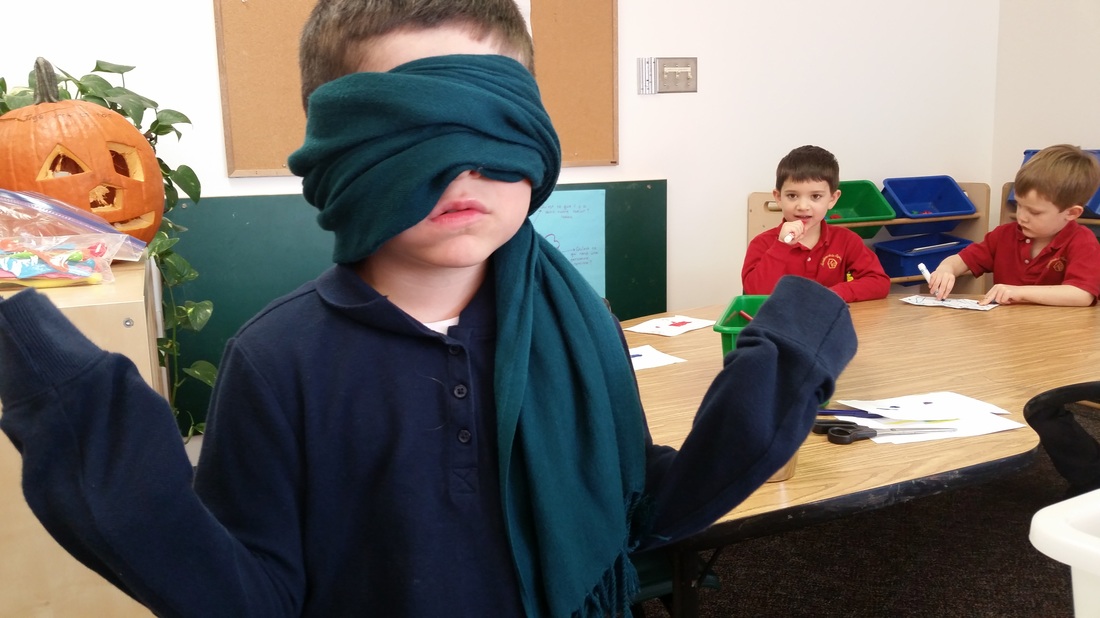
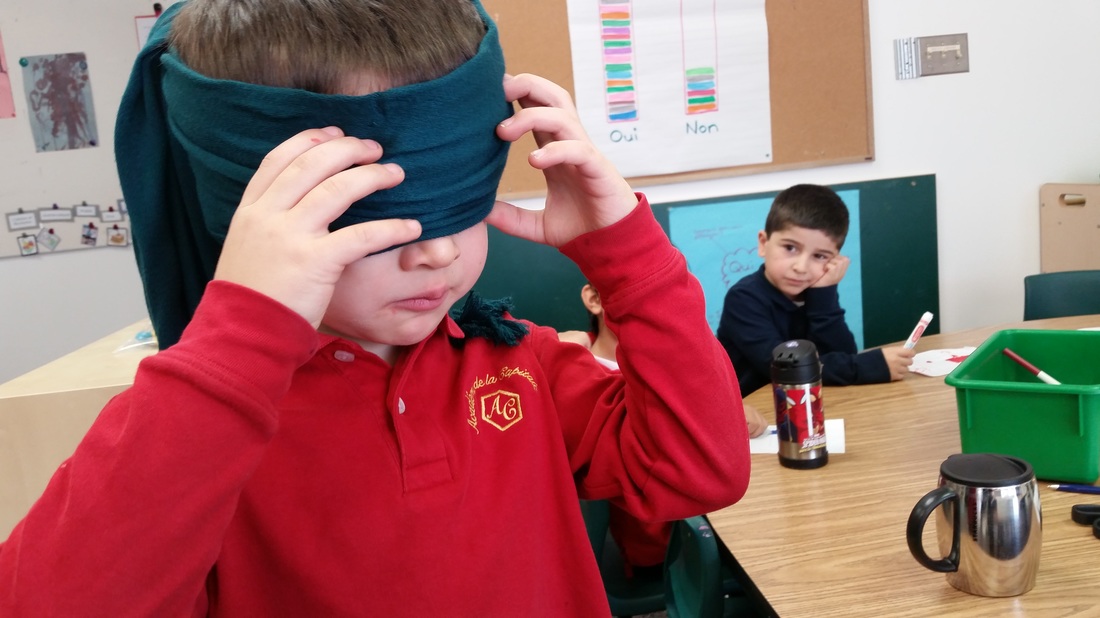
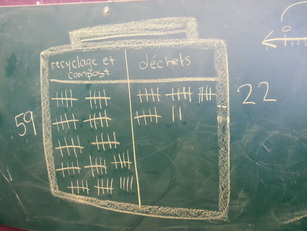
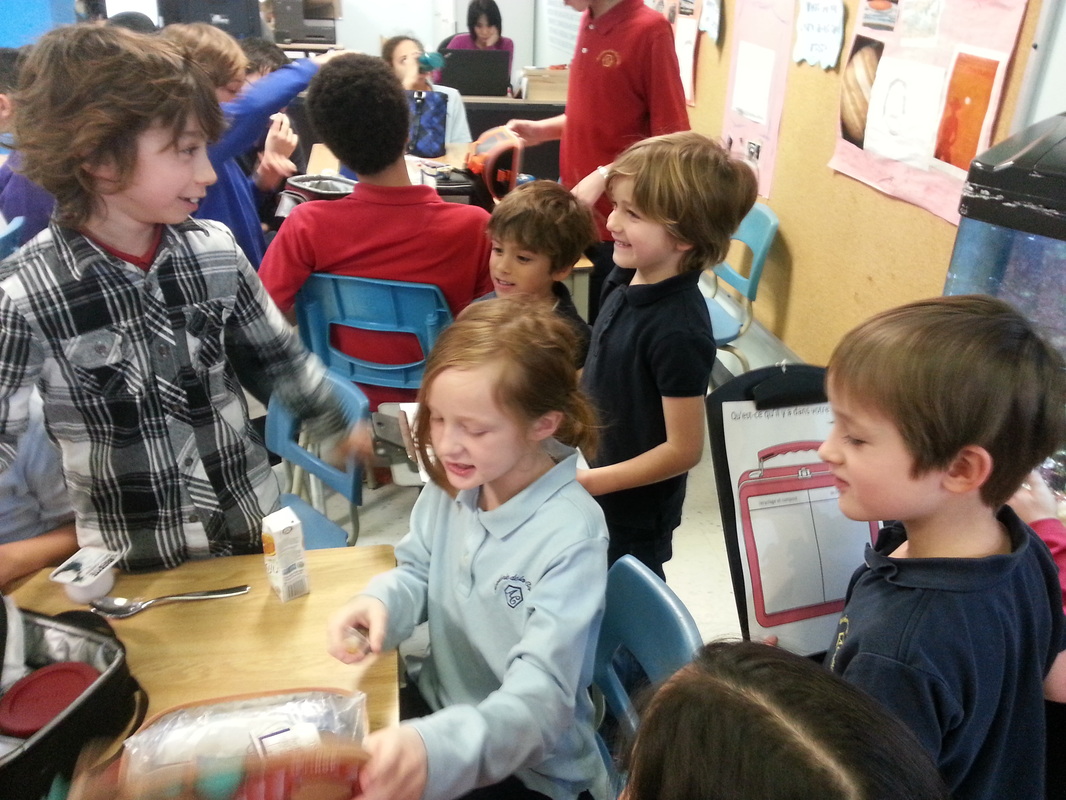
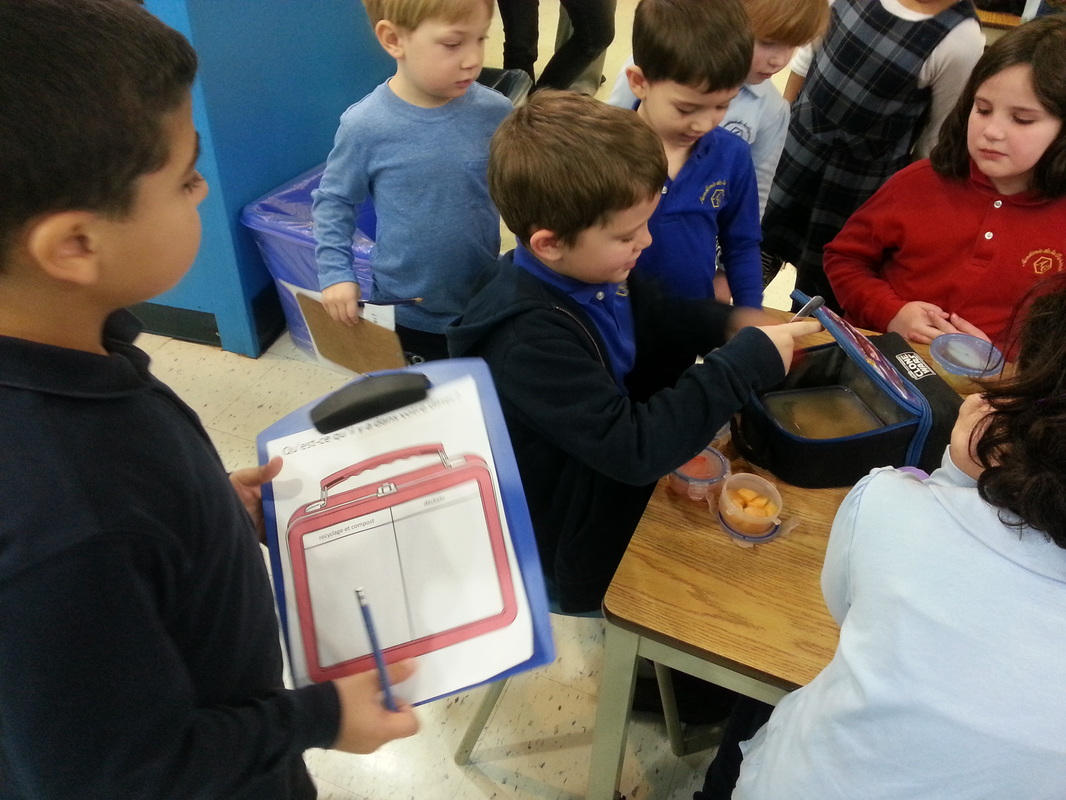
Today's unit of inquiry activity was all about our needs vs our wants. Each student got a few yellow sticky notes and a few blue sticky notes. On the yellow, they were asked to draw a picture of something they needed to grow and be healthy. On the blue sticky note, things that they wanted but would still survive without. There were some interesting conversations that came up when they explained their reasoning. Something that I loved to see was the addition of winter clothing to the needs side of the chart, which is very true! Another interesting choice of one of the students was a pillow that they thought should be placed in the needs side of the chart. After much discussion, the pillow went over to the wants side! 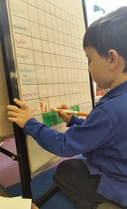 Last week, we went down to our cubbies to collect some data on all the winter clothing items we had at school. Each student took a turn to go to their cubby and answer yes or no to whether they had the various items on our list. Today, we looked at all the data and graphed it! We also learned how to read this type of graph quickly and efficiently without having to count every coloured box in the row. Each student took a turn filling in one of the bars on the graph and then we reread all the data together! Tuning in and using our sense of taste to figure out what we were eating turned out to be a really funny activity. Silence filled the room as the blindfolded child tasted the mystery food, everyone looked on in excitement and anticipation! Throughout the activity, students had the task of filling a chart to show whether they liked or disliked the food they tasted and I filled out a larger chart to record how many guesses students got right or wrong. We were risk takers, we were brave and we were enthusiastic during this activity! Below is our current tracking graph for reading buddies. The grade 1-2 students keep track of how many books they read and at the end, we record it on our graph. The groups choose their group name, hence the silly group names you see at the bottom of the graph! Our previous graphs only went up to about 50 and now that our readers are much more proficient, I had to make a graph that went up to 150! Big thanks to our grade 1-2 students for being such great role models! 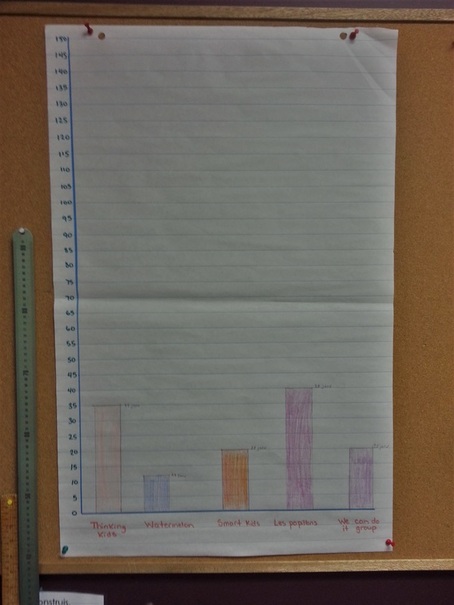
|
Welcome to the daily life of Académie de la Capitale's Junior / Senior Kindergarten class! We hope you enjoy this window into our classroom as much as we enjoy sharing it!Archives
October 2022
Categories
All
|

 RSS Feed
