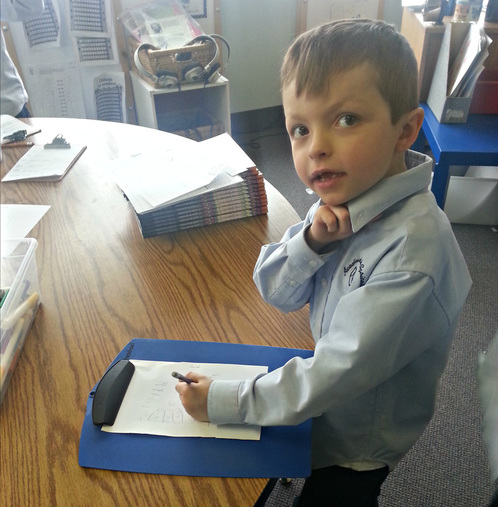
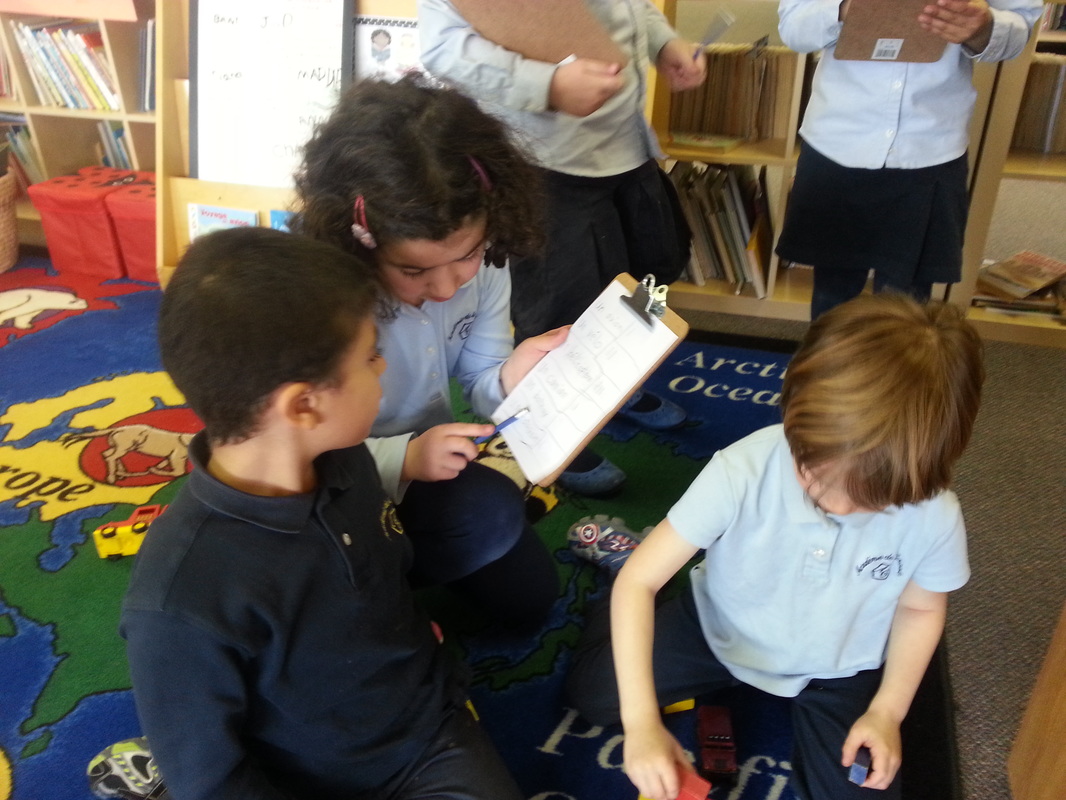
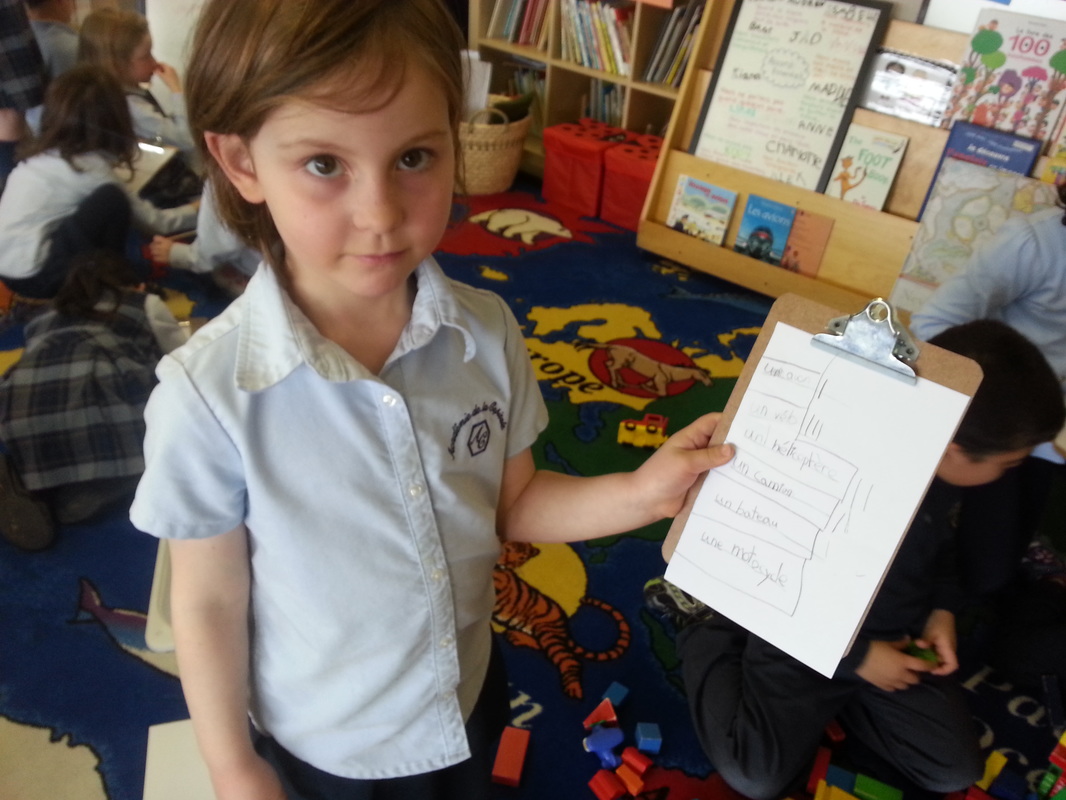
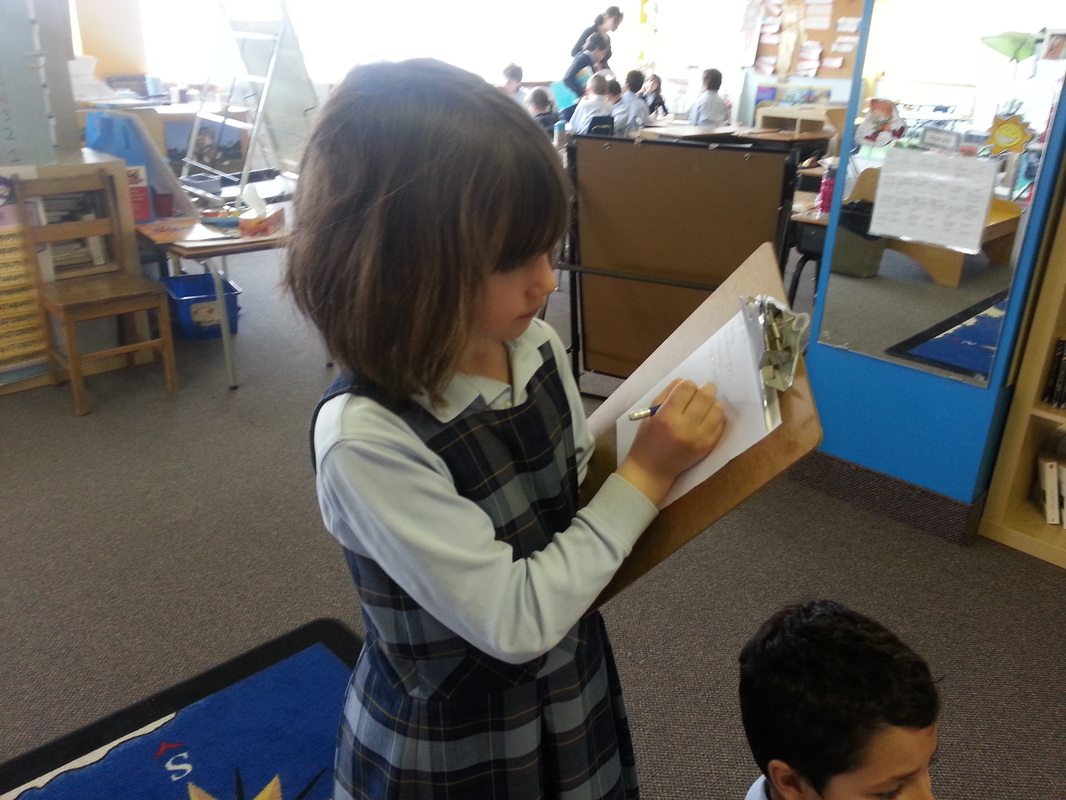
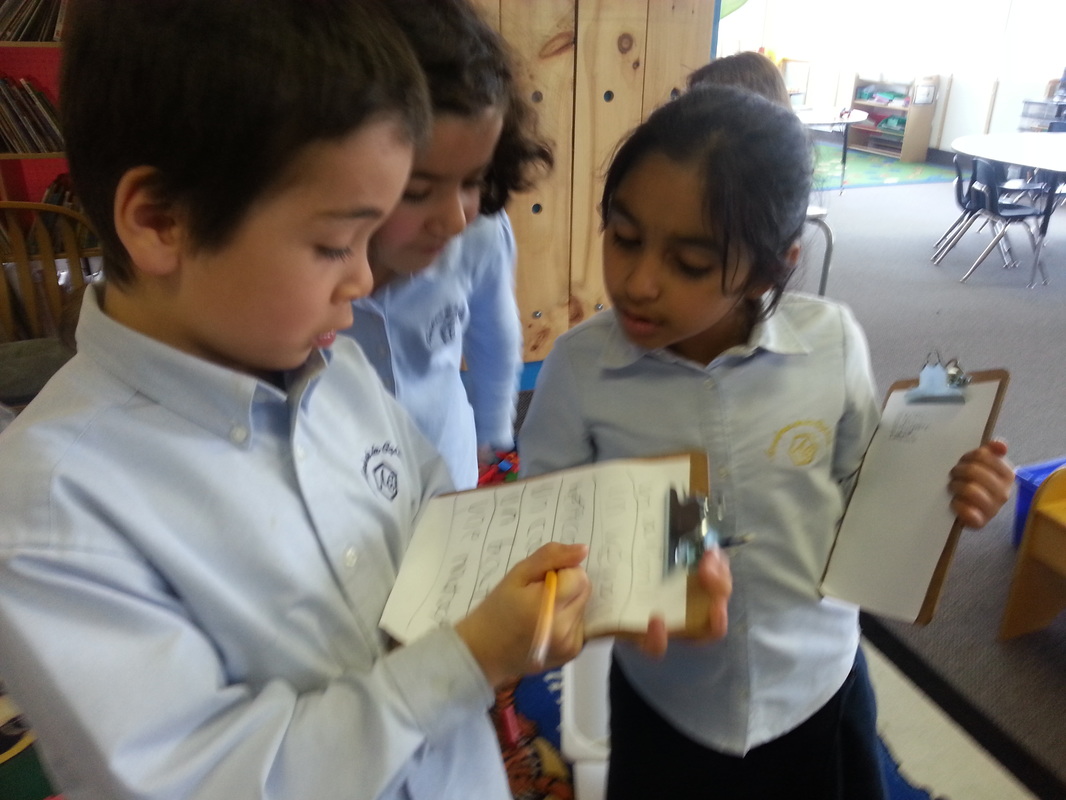
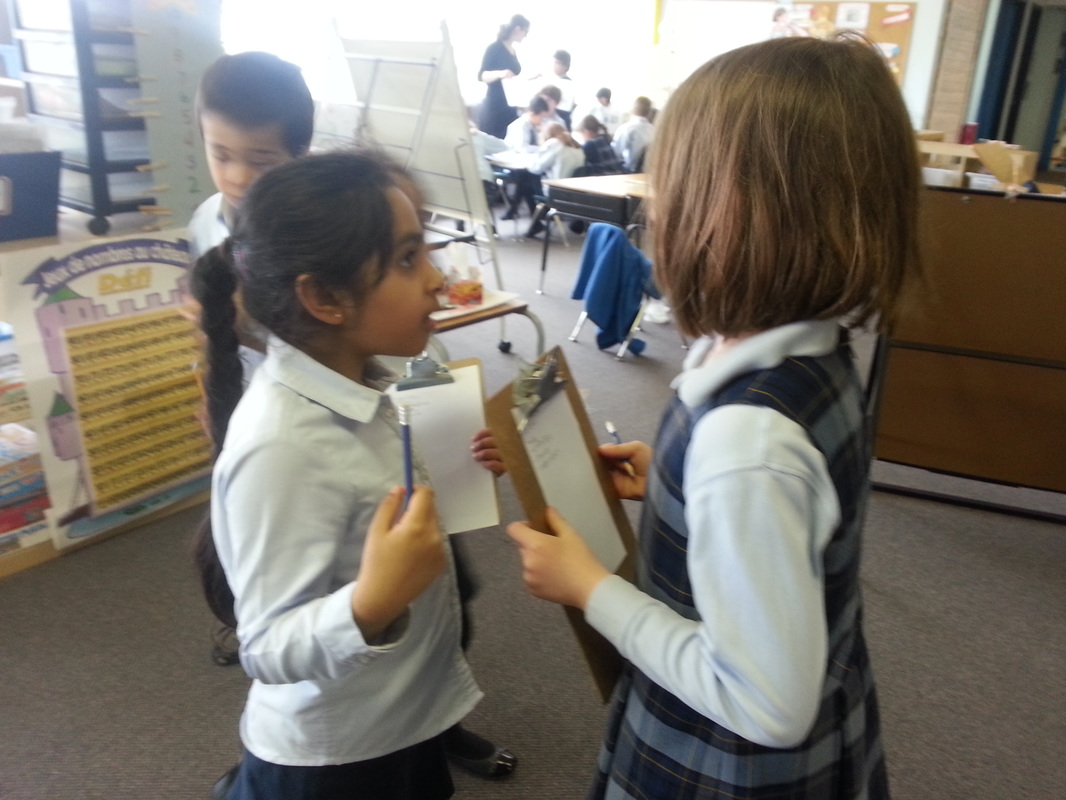
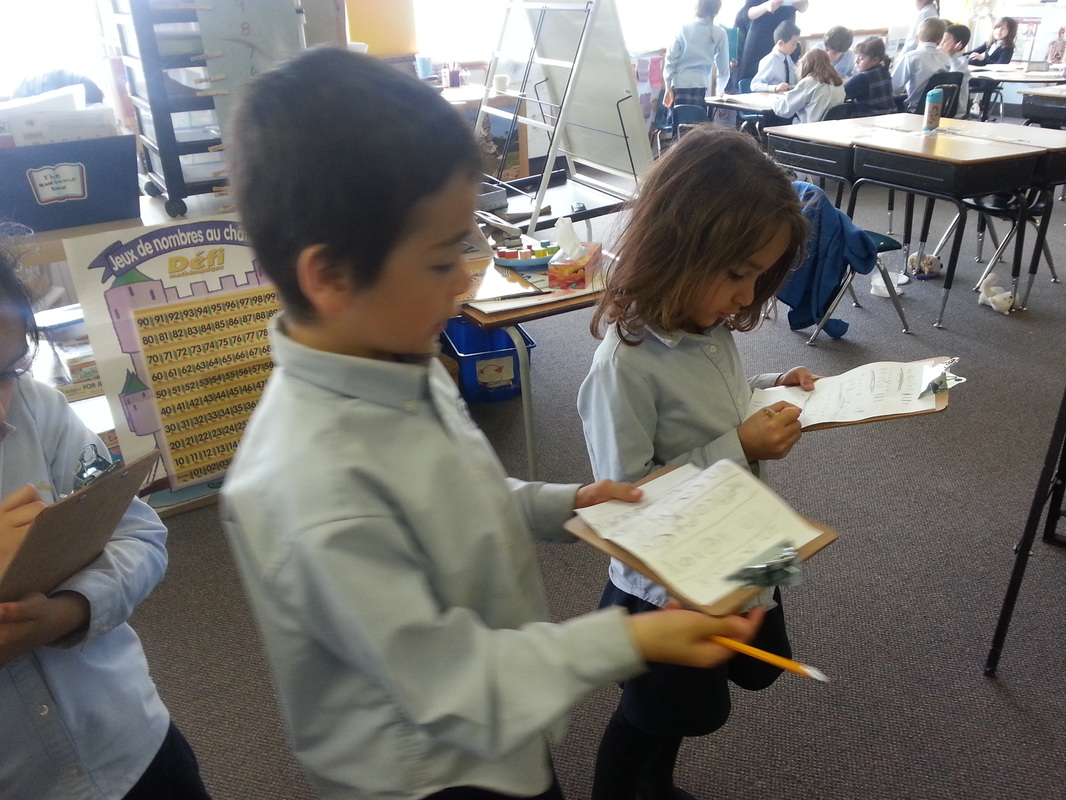
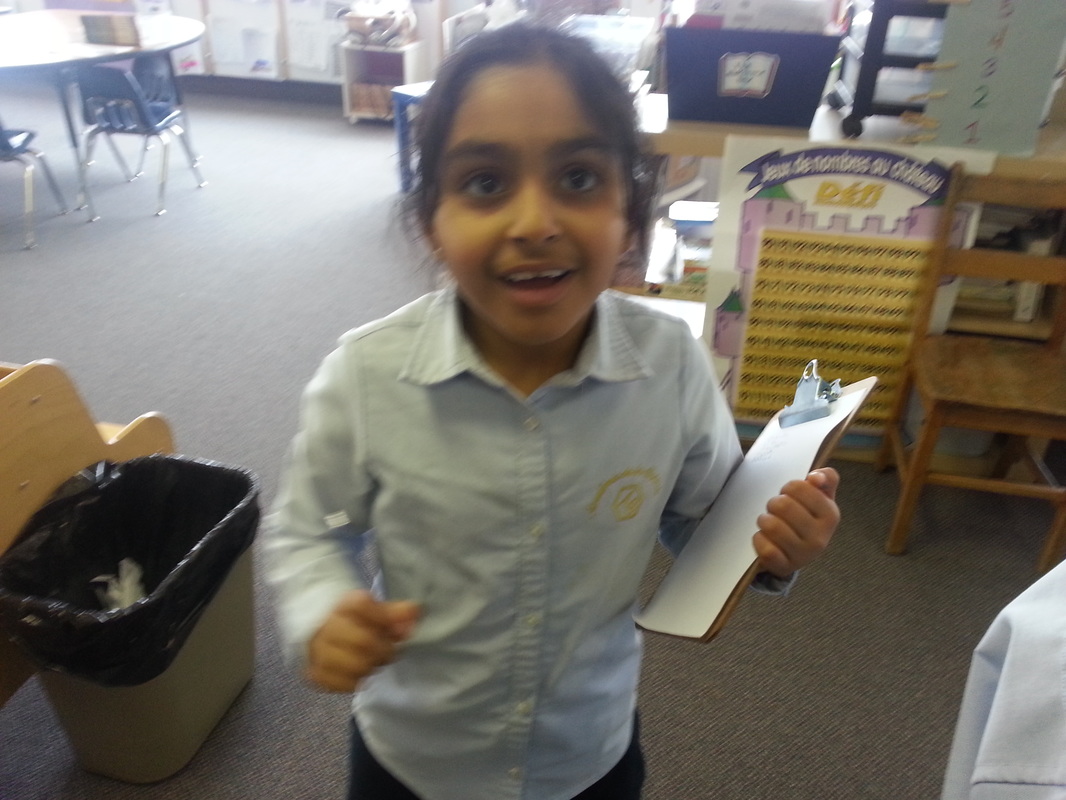
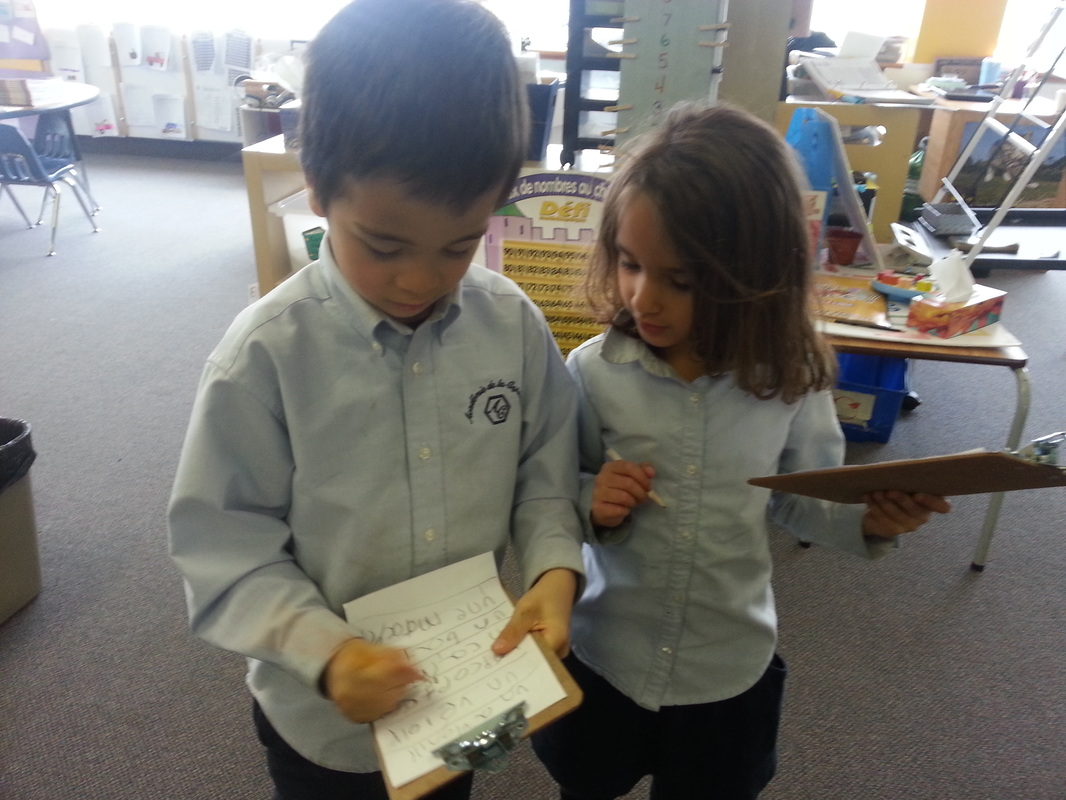
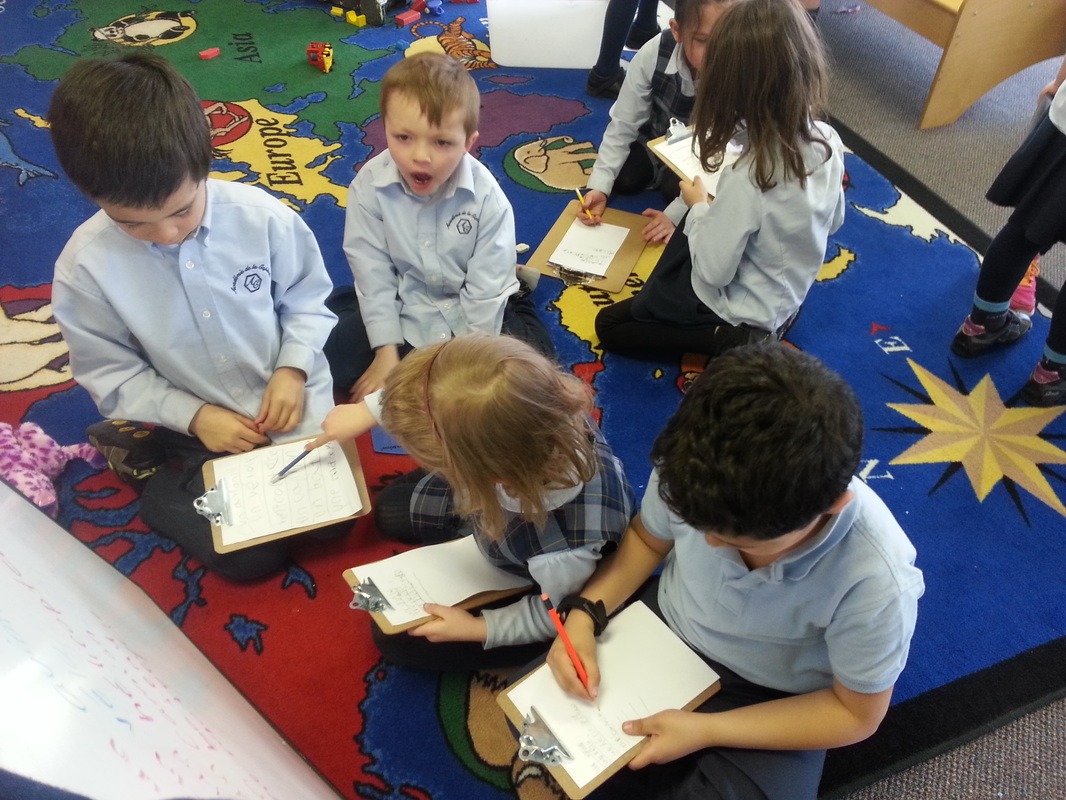
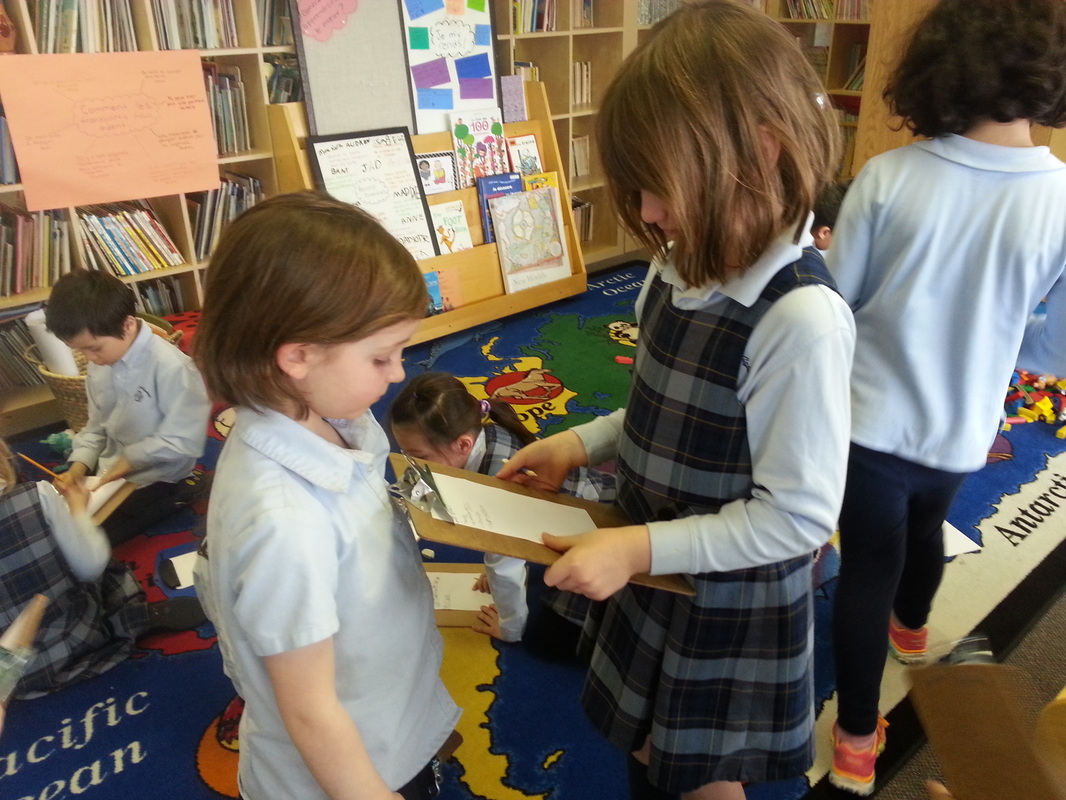
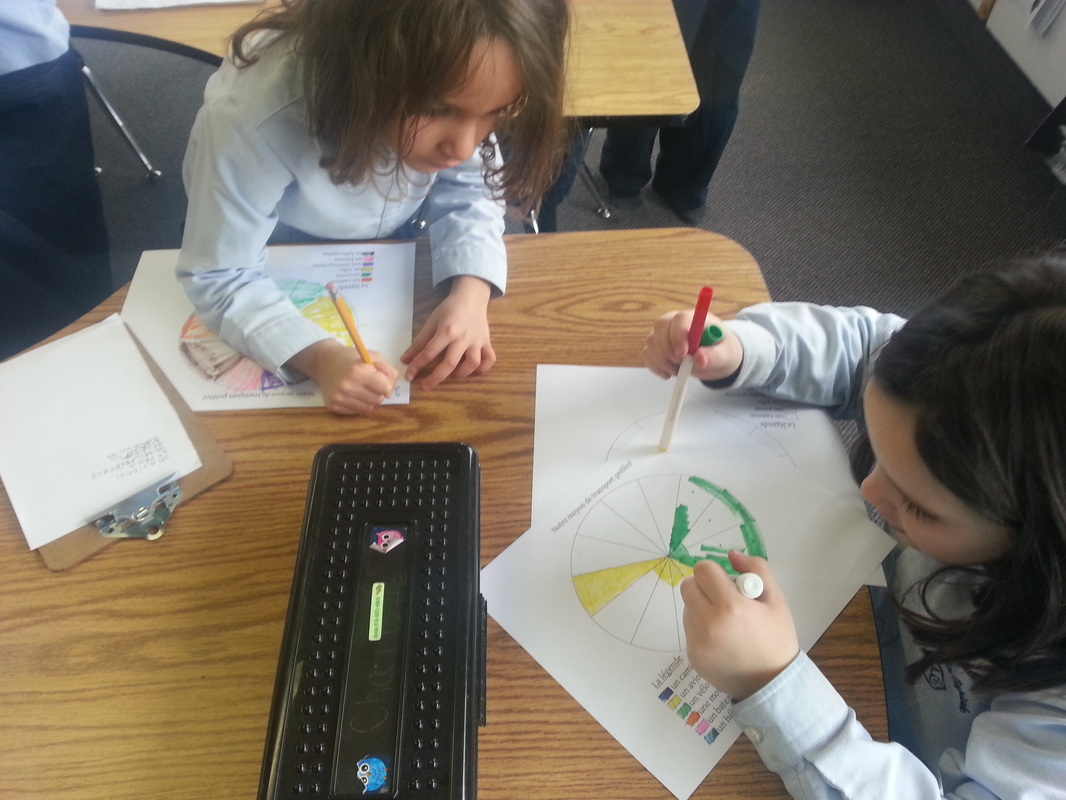
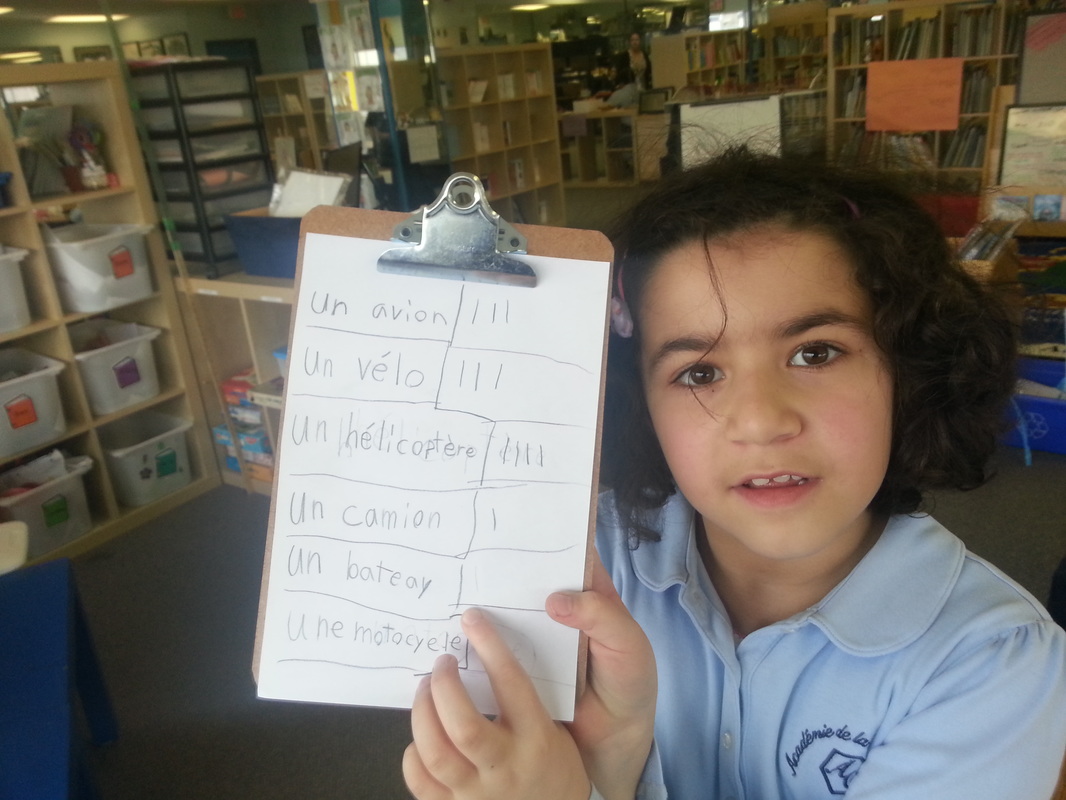
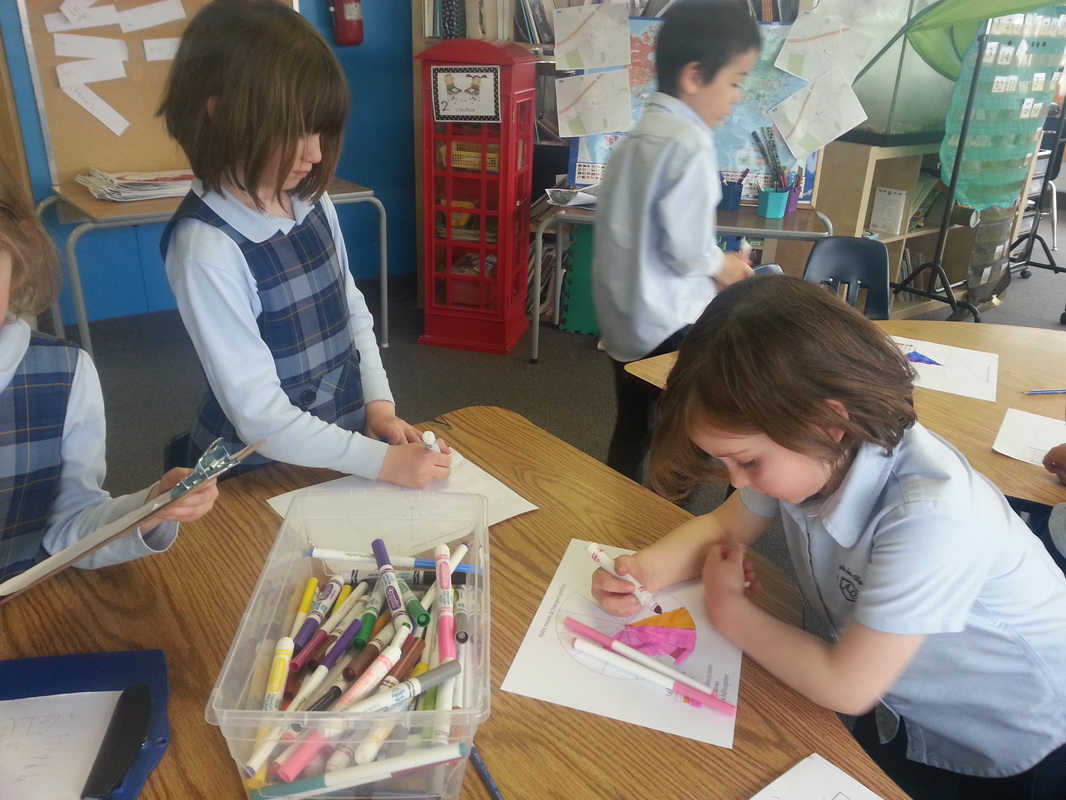
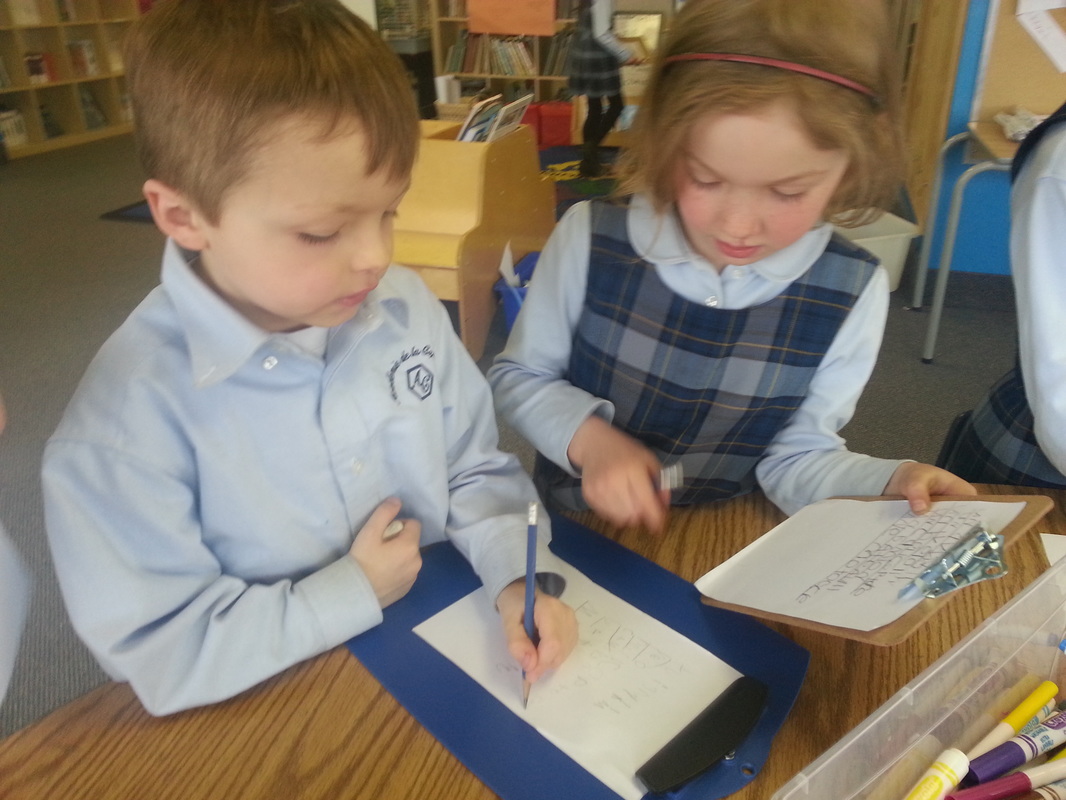
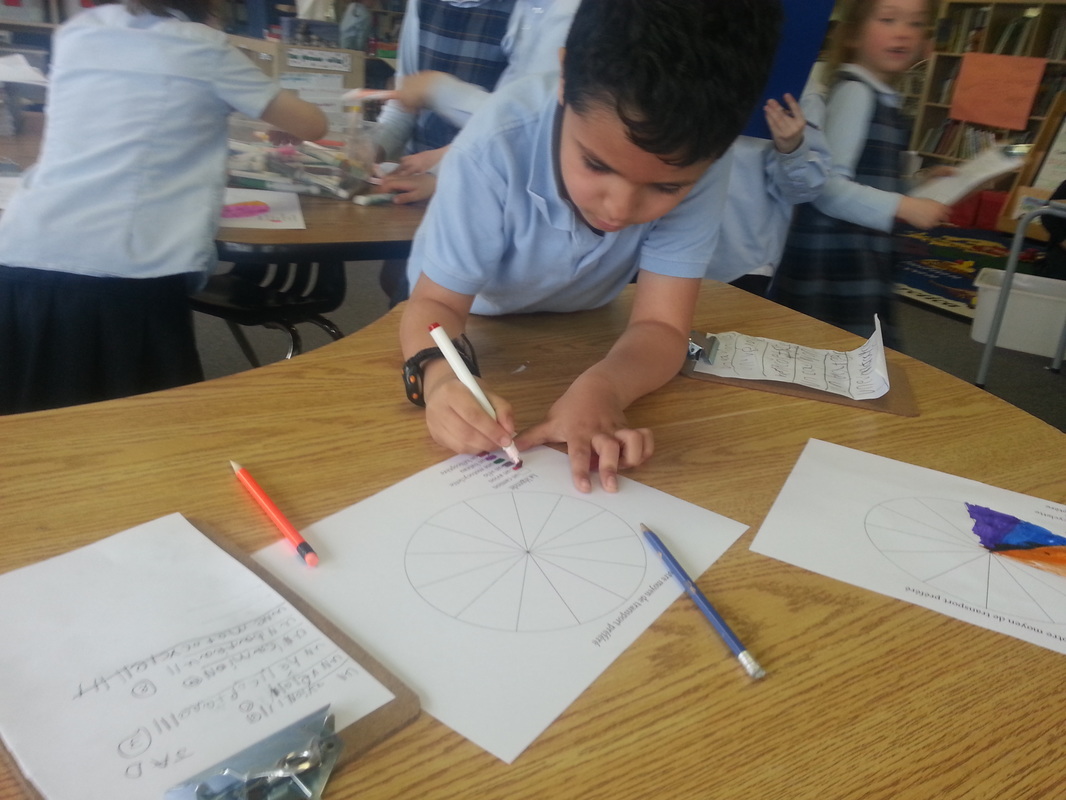
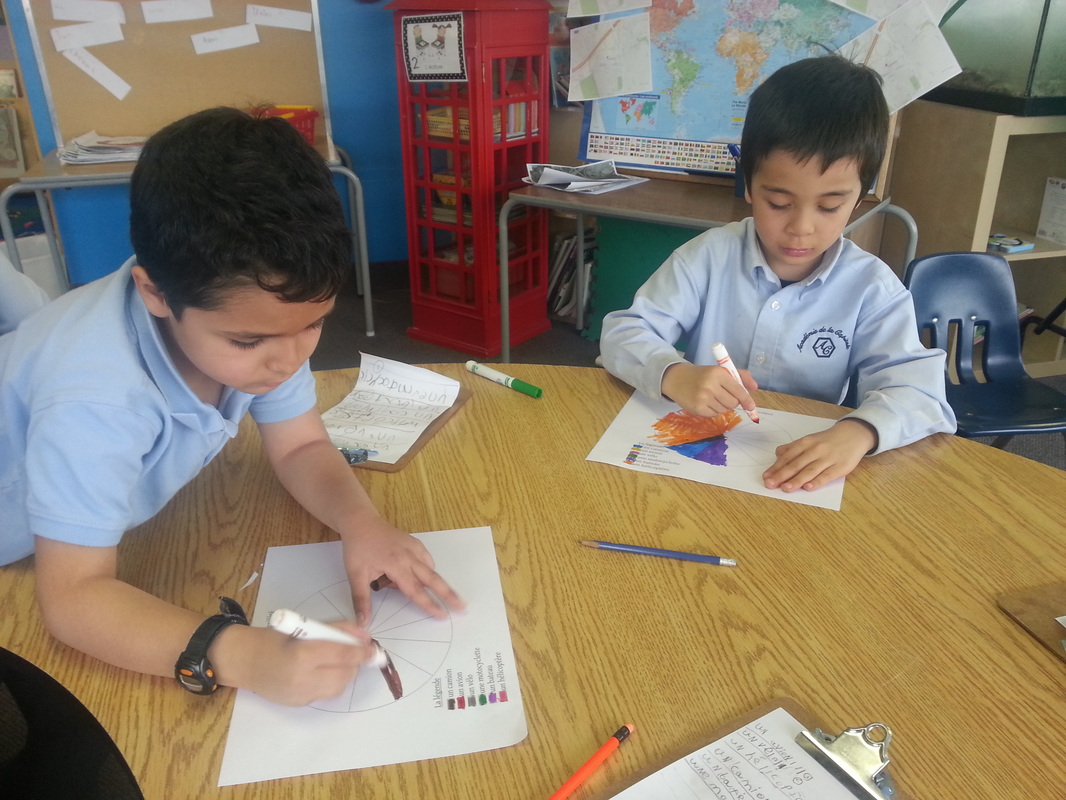
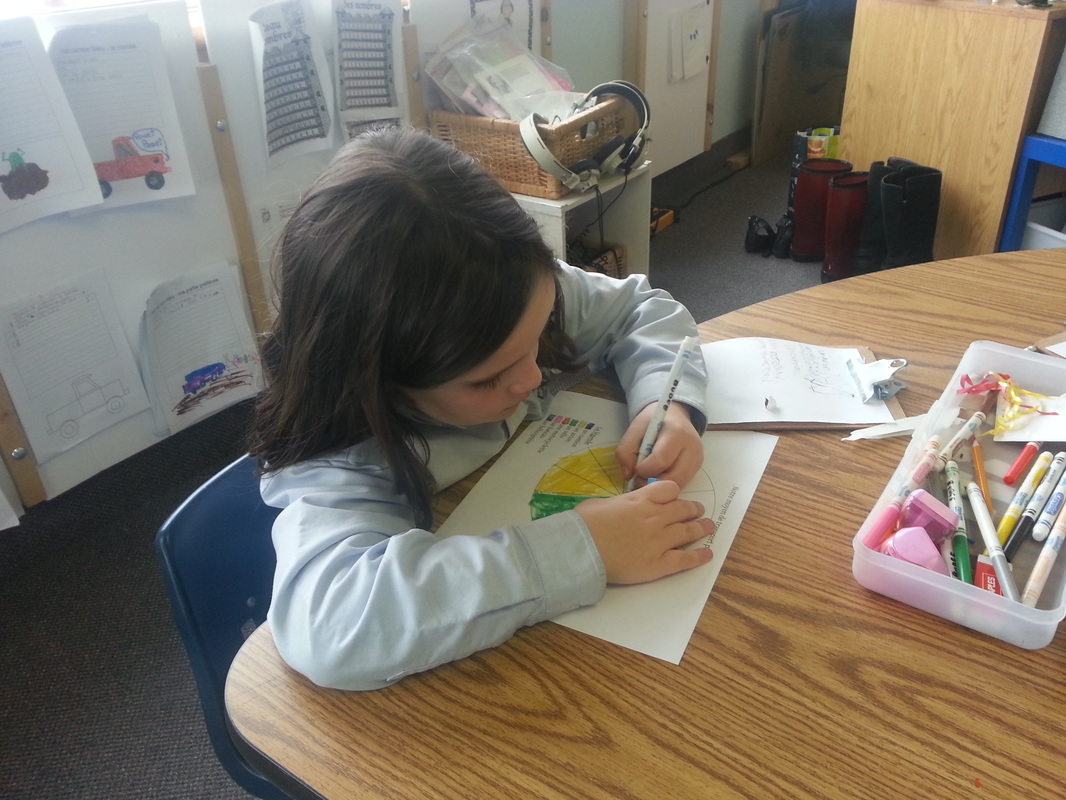
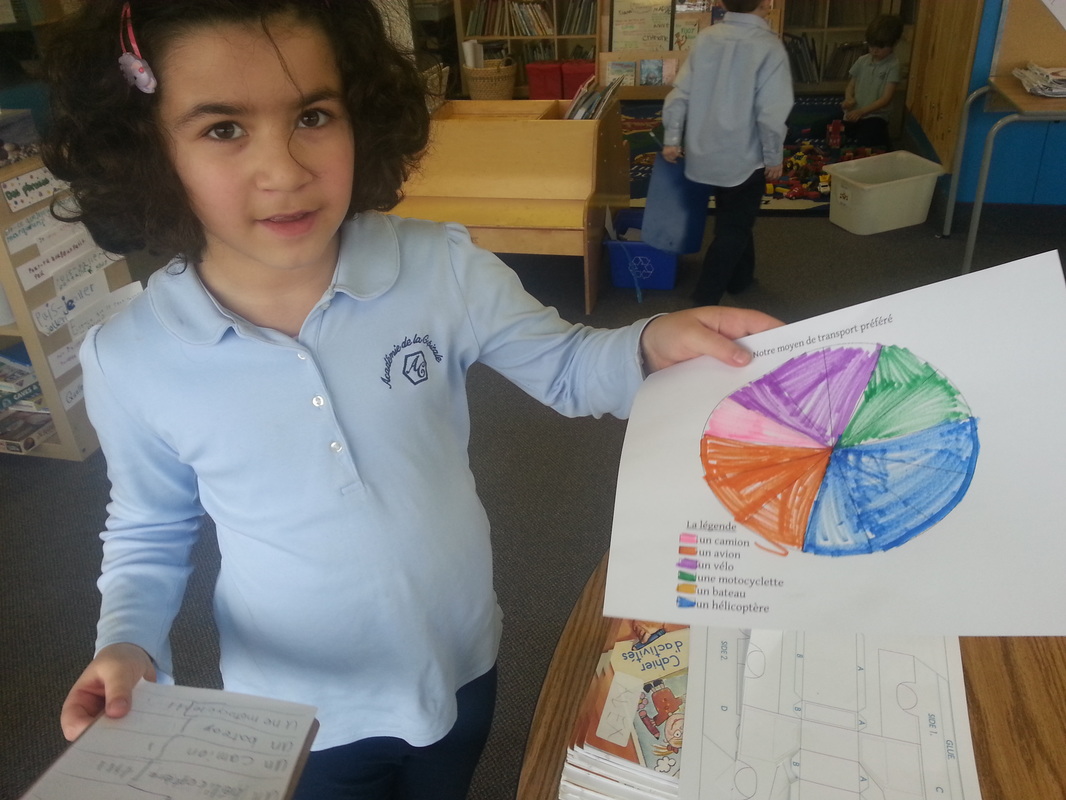
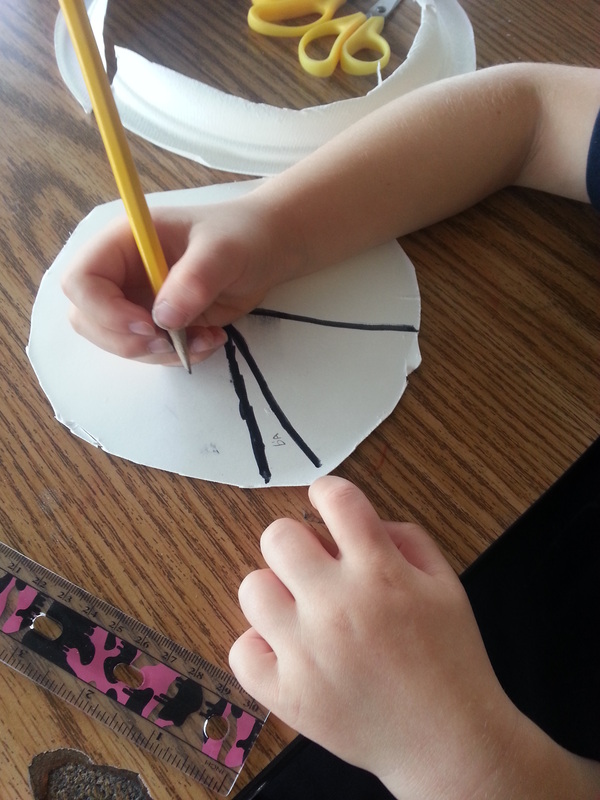
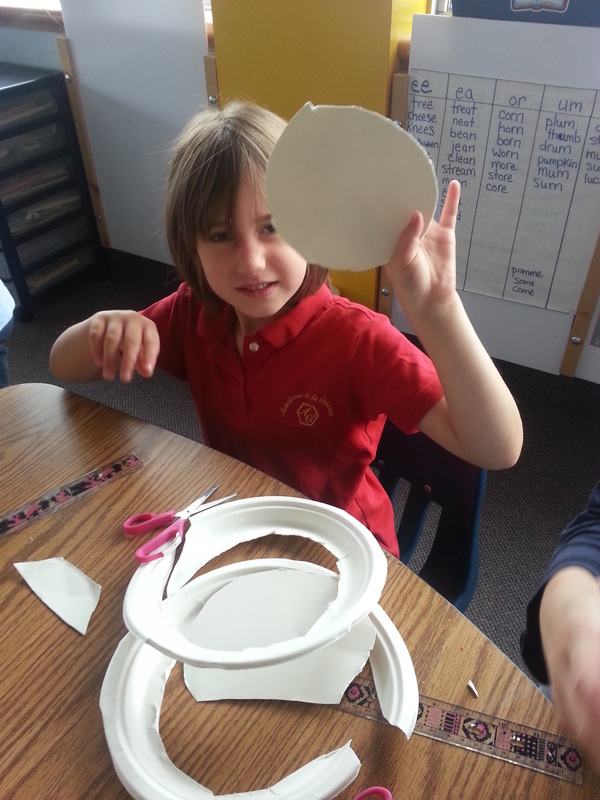
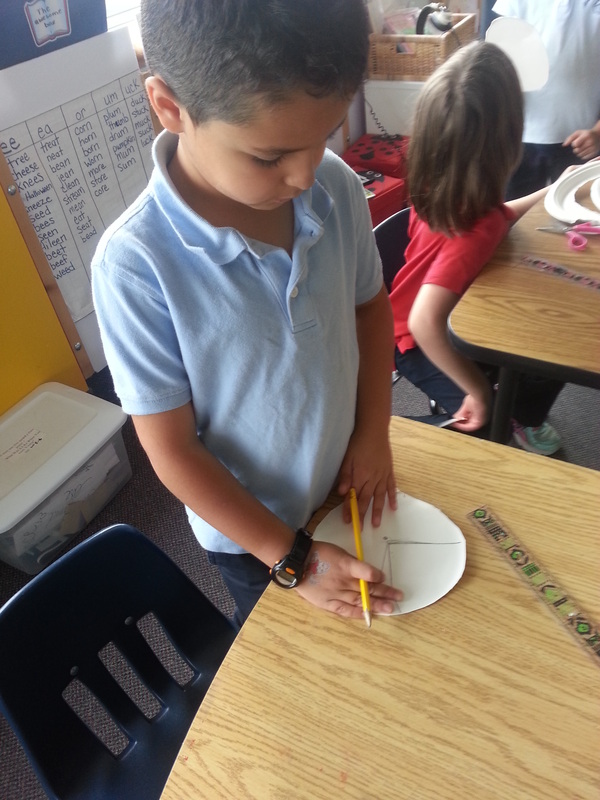
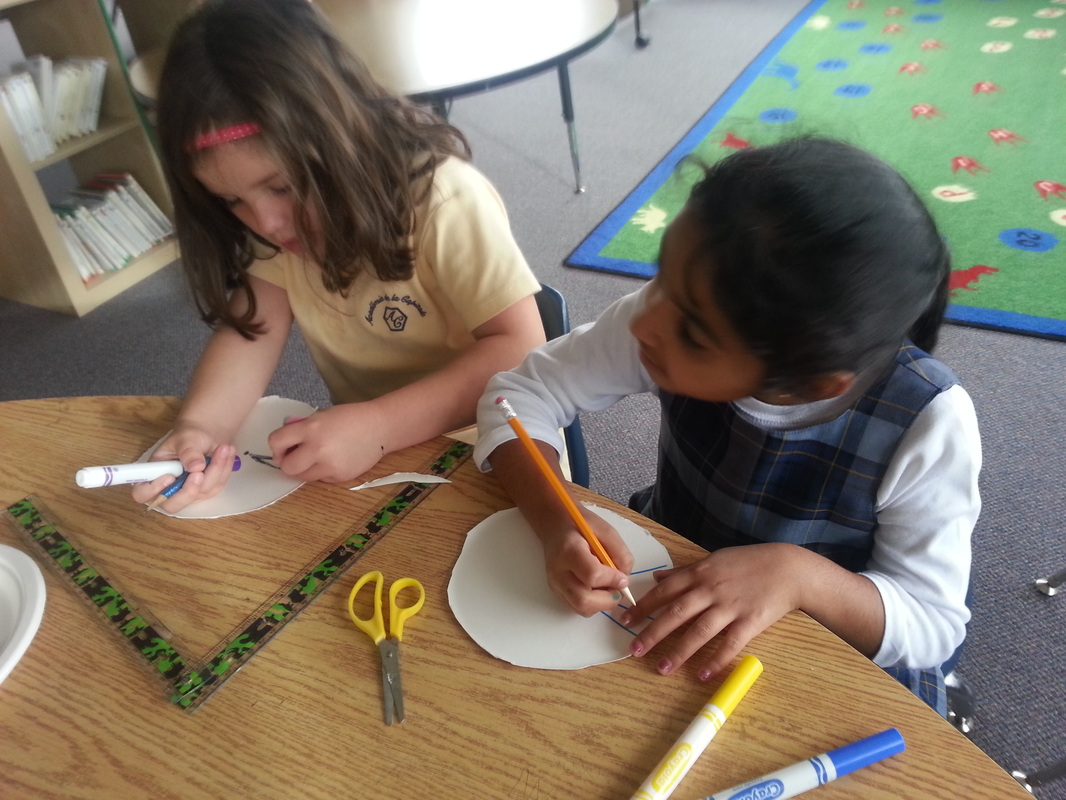
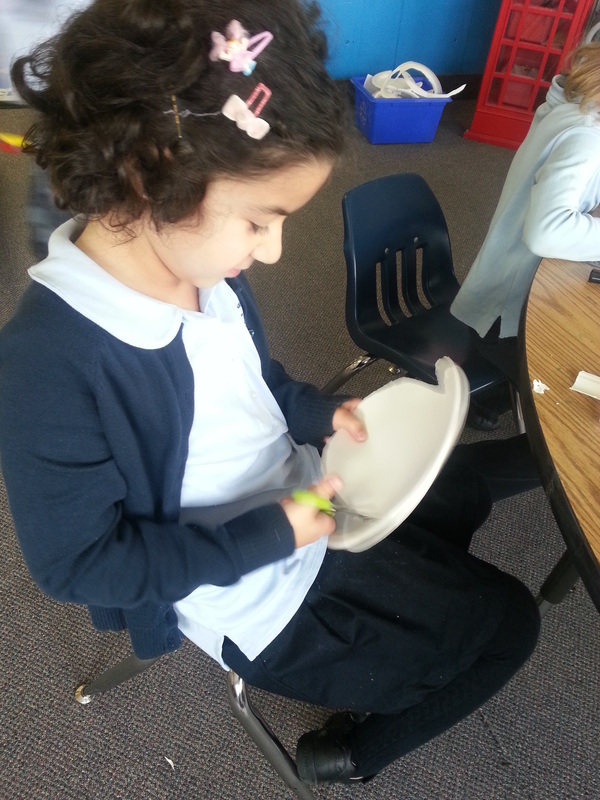
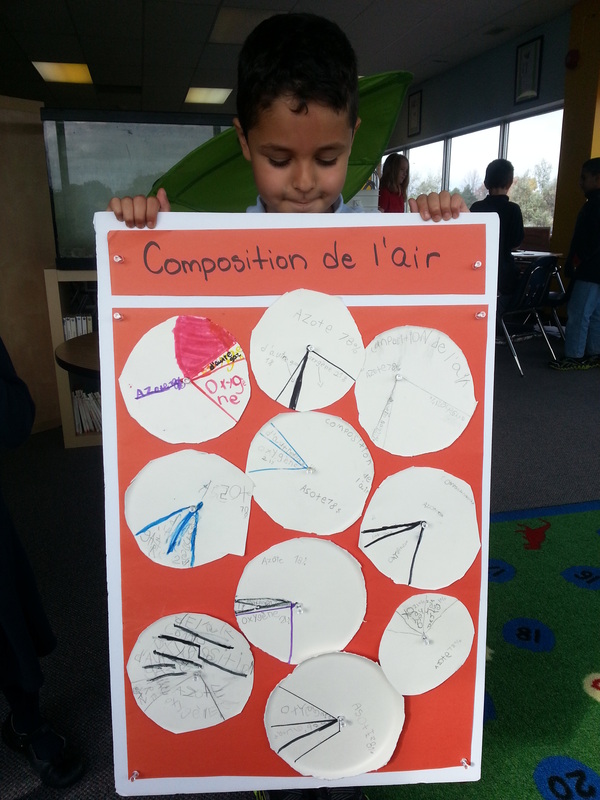
Let's do a poll of our favourite mode of transportation! After deciding on a few modes of transport and making sure we covered the three categories, land, sea and air, we went on our poll taking mission. Students bustled around the class asking their friends which they preferred from the selected few and recorded the answer. They then went on to the next part of the activity, representing the data they gathered. We used a pie chart template to graph the data and our information was ready to present. Now I would tell you what the preferred mode of transportation was among the ones we chose but somehow not everyone has the same final tally. Rest assured that all the graphs were completed accurately but I imagine that some silly friends changed the answer they gave from one poll taker to another. The activity was a success nonetheless!
0 Comments
After discussing what we know about air and what we want to know about air we came to realize that we do know that air is composed of oxygen but we don't know if there is anything else in the composition of air. So then the pie chart was introduced. We have looked at other data graphs but have not explored the world of pie charts yet. Perfect opportunity! Using paper plates, we cut out the flat circular interior of the plate and then made a dot in the center. Using the printout as a guide we marked the sections and labelled away!
Now that we have the weather data for April, we started counting and documenting the information and will graph it all this week. Students wrote down the weather words and the corresponding number on their chalk board for future reference. Just by observing the collected data, some students are able to estimate which type of weather had the highest and lowest number of days. Great work! Yesterday afternoon we played an exciting game that involved rolling shape dice and graphing the results. We reinforced French vocabulary pertaining to the activity and strengthen our cooperation and turn taking skills! This simple yet very fun game was a hit! At the end, the groups counted the amount of times each shape was rolled and added we added it all together. It became a game of which shape will win...it was a tie between square and hexagon...if I recall correctly ;)
_Pour documenter le nombre de petits livrets nous avons lu, nous avons fait un diagramme à _ bandes. Comme ça, les élèves peuvent visualiser la quantité de livres ils ont lu et ça leurs encourage à lire aussi! Ca leur donne de joie de voir le grand nombre de livres ils ont lu! Finding learning opportunities wherever we can!
|
Welcome to the daily life of Académie de la Capitale's Junior / Senior Kindergarten class! We hope you enjoy this window into our classroom as much as we enjoy sharing it!Archives
October 2022
Categories
All
|